

Top 5 Methods for Olive Oil Adulteration Detection
If you want to know whether olive oil is mislabeled, labs usually rely on five main checks: GC, spectroscopy, NMR/HRMS, DNA testing, and quality plus sensory testing. No single test catches every problem, so labs often start with low-cost screening and then confirm suspect samples with more detailed tools.
Here’s the short version:
- Gas chromatography (GC) checks fatty acids, sterols, and TAG-related markers. It’s one of the main lab tools for finding seed oil, pomace oil, or refined olive oil in blends.
- Spectroscopy like FT-IR, NIR, Raman, and fluorescence gives a fast fingerprint of the oil. It’s often used to flag lots that need more testing.
- NMR and HRMS look deeper at structure and trace compounds. Labs use them when routine results don’t settle the question.
- DNA testing helps with cultivar, species, and origin claims, especially when chemistry alone can’t sort it out.
- Physicochemical tests and sensory panels check grade, oxidation, refining signs, and taste defects. In many cases, these are the first checks run.
A few numbers matter right away:
- EVOO free fatty acidity: ≤ 0.8%
- Peroxide value: ≤ 10 meq O₂/kg
- K270: ≤ 0.22
- Stigmastadienes for virgin oil: < 0.01 mg/kg
- Some adulteration can be spotted at about 1% to 5%, but other cases may take 10% or more before a method can flag it with confidence.
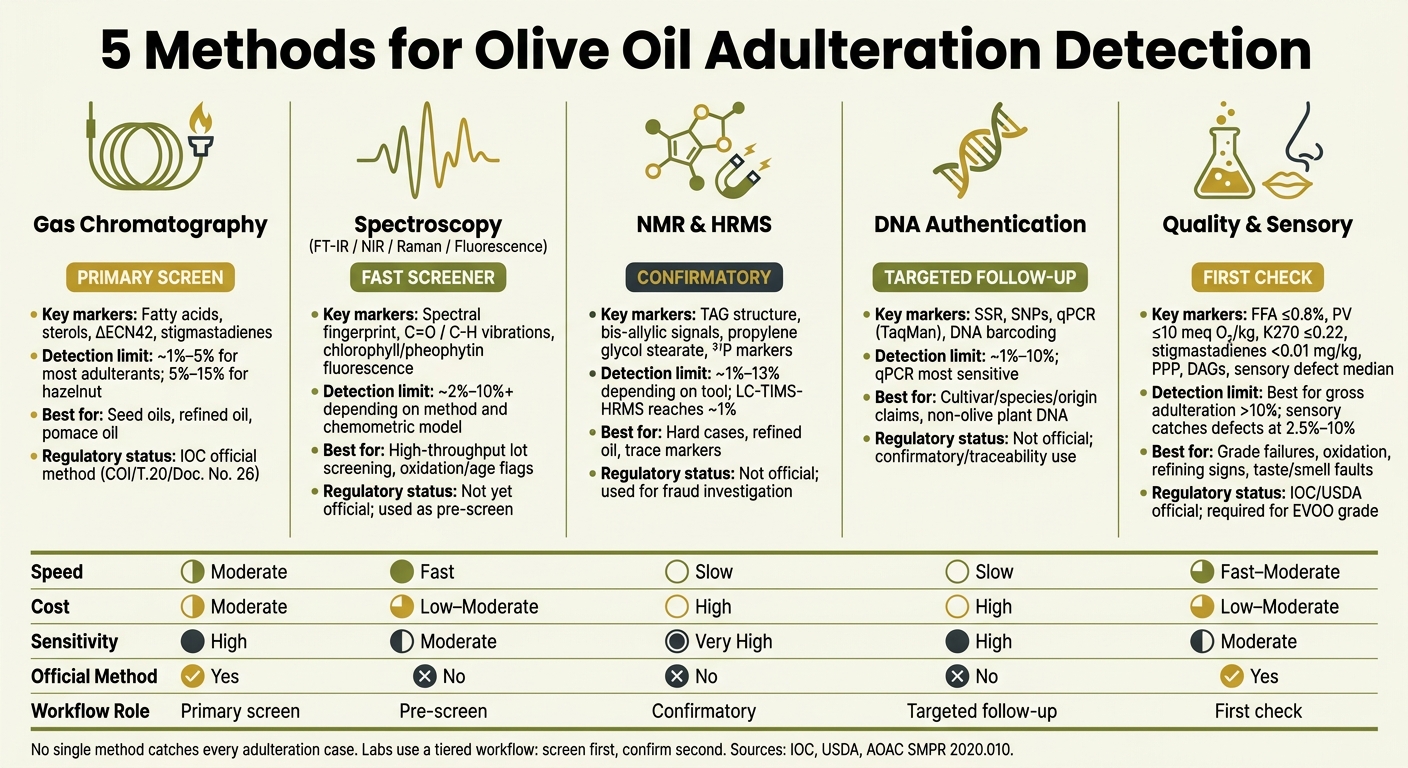
5 Olive Oil Adulteration Detection Methods Compared
Quick Comparison
| Method | Main job | What it can spot | Rough sensitivity |
|---|---|---|---|
| GC | Main chemistry check | Seed oils, refined oil, sterol shifts | About 1% to 5% for some cases |
| Spectroscopy | Fast screening | Pattern changes from blending, age, heat | About 2% to 10%+ depending on method and model |
| NMR / HRMS | Follow-up confirmation | Hard cases, refined oil, trace markers | About 1% to 13% depending on tool |
| DNA | Species/cultivar/origin follow-up | Non-olive plant material, label claim checks | About 1% to 10% in published work |
| Quality + sensory | Grade and defect check | Oxidation, refining signs, taste/smell faults | Best for grade failures and larger quality issues |
If I strip it down even more, the takeaway is simple: labs do not rely on one number or one machine. They compare chemical markers, spectral patterns, and sometimes DNA or sensory data to decide whether an oil matches the label.
sbb-itb-4066b8e
What Olive Oil Labs Test for in the U.S. Market
U.S. labs check olive oil for chemical signs that show whether the oil matches what the label claims. The most common fraud issue is economic adulteration: blending EVOO with cheaper oils. That usually means mixing in sunflower, soybean, canola, corn, or hazelnut oil. Labs also watch for refined olive oil and olive-pomace oil. Hazelnut oil is one of the tougher cases because its fatty acid pattern looks a lot like olive oil. Refined and pomace oils are also common picks since they can keep a somewhat similar taste while cutting cost.
Sometimes the blend is small, just 5%–10%, to slip past routine checks. Other times, the fraud is much heavier, with seed oil making up most of a product sold as extra virgin. Because of that, labs build their test panels around known fraud patterns, especially for imported bulk oils that end up with U.S. bottlers and retailers. Different adulterants leave different chemical traces, so labs usually screen several marker types at the same time.
Labs report results in standard units so they can compare samples against set limits. Fatty acids and sterols are reported as percent (%) or milligrams per kilogram (mg/kg). Oxidation and refining markers use UV absorbance measures like K232, K270, and ΔK at fixed wavelengths. Free fatty acid content is reported as % oleic acid, and peroxide value is reported in milliequivalents of active oxygen per kilogram (meq O₂/kg). Those units make direct comparison possible against IOC, ISO, AOCS, and USDA thresholds.
| Parameter | Unit | Standard Reference |
|---|---|---|
| Free fatty acidity | % oleic acid | IOC / USDA (≤0.8% for EVOO) |
| Peroxide value | meq O₂/kg | IOC / USDA (≤10 for EVOO) |
| UV absorbance | K232, K270, ΔK (dimensionless) | IOC / AOCS |
| Fatty acids & sterols | % or mg/kg | IOC / ISO |
| Stigmastadienes | mg/kg | IOC (<0.01 mg/kg for virgin) |
These markers help labs decide what to do next. One test alone won't catch every type of adulteration. Fatty acid profiling can spot sunflower or corn oil, but blends made with high-oleic sunflower oil can still sit inside accepted ranges. Sterol analysis helps narrow things down, but natural differences between olive varieties can make edge cases harder to judge. So labs use a tiered workflow: screening first, confirmation second. In plain English, they start broad and then move to follow-up methods when a sample lands outside the normal range. The next five methods show how that process works in practice.
1. Gas Chromatography: Fatty Acid and Sterol Profiling
Gas chromatography (GC) measures the fatty acid and sterol markers used to check olive oil identity. Since shifts in fatty acids and sterols are among the best-known lab signals, GC is often the first test labs use to confirm whether an oil fits extra virgin olive oil standards.
Primary authenticity markers
In day-to-day lab work, GC turns the marker set from the previous section into data that can be checked against compliance limits. Genuine EVOO usually shows oleic acid in the 55%–83% range, along with lower linoleic and linolenic acids. If cheaper seed oils are mixed in, those ratios tend to move in familiar patterns.
The sterol profile gives labs another way to check the sample. Authentic EVOO is led by β-sitosterol, while campesterol must stay below 4.0%–4.5% of total sterols. Canola and rapeseed oils contain brassicasterol, which makes that marker especially useful. In one study on olive-pomace oil adulteration, brassicasterol rose from 0.02% to 0.17%–0.22% as adulteration increased from 5%–10%, which pushed it past the IOC's 0.1% limit.
GC also supports ΔECN42 testing. For virgin olive oils, the IOC limit is set at ≤|0.2|.
Typical detection limit
GC can spot some adulterants at low levels. For sunflower oil, 1% adulteration can be detected through an increase in Δ7-stigmastenol. For corn oil, 4% adulteration leads to higher campesterol levels. Trans-fatty acid thresholds can fall to 2%–4%, depending on the adulterant.
Pair GC data with chemometric models like PLS-LDA, and the method gets sharper. Studies report a 1% detection limit with about 90% prediction accuracy. Hazelnut oil is a tougher case. It often takes 5%–15% adulteration before GC can flag it with confidence.
Regulatory acceptance
The IOC reference method COI/T.20/Doc. No. 26 sets the framework for sterol analysis by capillary gas chromatography, and labs around the world use it. In the U.S., USDA grade standards also rely on sterol thresholds. For instance, campesterol between 4.0% and 4.5% leads to follow-up testing.
If GC results land in a gray area, labs usually move on to NMR or high-resolution mass spectrometry for a second check.
2. Vibrational and Fluorescence Spectroscopy with Chemometrics
When GC leaves a lab with more questions than answers, spectroscopy can step in as a fast, non-destructive screening tool. Vibrational spectroscopy - FT-IR, NIR, and Raman - and fluorescence spectroscopy can generate a spectral fingerprint of olive oil in very little time. If a producer blends in cheaper seed oils, or if the oil is aged or overheated, that fingerprint changes in ways instruments can pick up. Chemometrics does the sorting work, helping labs separate authentic oils from adulterated ones.
Primary Authenticity Markers
FT-IR tracks C=O ester stretching and C–H bending vibrations. Those signals move when oils with different fatty acid profiles are mixed in. NIR looks at overtone bands tied to C–H, O–H, and C=O groups, while Raman follows double-bond and chain-conformation signals that shift with changes in unsaturation.
Fluorescence spectroscopy focuses on chlorophylls, pheophytins, oxidation products, and certain phenolics. Authentic EVOO has emission peaks linked to chlorophyll and pheophytin. When sunflower oil or other seed oils are added, the fluorescence pattern shifts toward a broader emission band in the 440–490 nm range. As oils sit on the shelf or go through repeated heating, chlorophylls break down and oxidation products build up. Chemometric models can tell those patterns apart from fresh EVOO.
Typical Detection Limits
Published studies report these approximate screening limits:
| Method | Typical adulterant or use | Reported detection limit |
|---|---|---|
| NIR + chemometrics, with a matched authentic reference | Corn, sunflower, soybean, walnut, hazelnut | About 2–3% w/w |
| NIR + chemometrics, generic screening without a matched reference | Corn, sunflower, soybean, canola | About 10–20% v/v, depending on adulterant |
| FT-IR (mid-IR) + chemometrics | Rapeseed, cottonseed, corn-sunflower blends, sunflower, soybean, sesame | About 5–10% v/v; many studies fall around 6–9% |
| Raman or combined MIR/Raman + chemometrics | Seed oils, hazelnut oil | About 5–8% v/v in some studies |
| Synchronous fluorescence + chemometrics | Lower-grade olive oil blends | About 8.4–8.9% adulteration |
These numbers are best treated as screening limits, not enforcement cutoffs. Each lab still has to validate its own model. AOAC's Standard Method Performance Requirements (SMPRs) for non-targeted EVOO authenticity testing set a 5% v/v upper boundary for fraudulent admixtures, and that gives labs a practical benchmark for screening work.
Regulatory Acceptance and Workflow
These techniques are still not official reference methods for U.S. enforcement. The IOC, Codex Alimentarius, and EU regulators continue to rely mainly on chromatographic and physicochemical reference methods as the legal basis for authenticity decisions. In the U.S., agencies and independent labs use vibrational and fluorescence spectroscopy to flag suspect lots fast. A positive screen, though, still needs confirmation before any labeling decision or legal step.
In practice, labs use spectroscopy as the front-end filter. They screen lots fast, flag the ones that look off, and then confirm those samples with GC or other official reference methods. If a case needs deeper follow-up, flagged samples can then move to NMR or high-resolution mass spectrometry for confirmation.
3. Nuclear Magnetic Resonance and High-Resolution Mass Spectrometry
When GC and routine screening still leave some doubt, NMR and HRMS give labs a much closer look at what’s in the oil. That matters when a sample looks off, but standard tests still can’t settle whether it’s genuine.
NMR places oil in a magnetic field and reads hydrogen-1 or carbon-13 signals to show molecular structure. HRMS ionizes molecules and measures exact mass to spot markers linked to refining, deodorization, or seed-oil blending.
Primary Authenticity Markers
In ¹H NMR, the bis-allylic signal is stronger in soybean-adulterated EVOO than in pure oil, and a low C18:3 methyl signal can point to hazelnut adulteration. Weak signals around 1.20 ppm can flag refined or rectified oils. ¹³C NMR looks at triacylglycerol structure; palmitic residues at position 2 point to fraud. After derivatization, ³¹P NMR separates extra virgin, refined, and lampante oils using phosphorus markers and can detect refined oil adulteration at about 5% w/w.
HRMS looks for markers such as propylene glycol stearate that separate genuine oil from deodorized blends. It can also detect processing-related contaminants or flavor-stripping markers that bulk quality indices would miss.
Typical Detection Limits
Published limits vary, so labs usually use these methods as support for confirmation, not as stand-alone enforcement tools. In practice, they work best as confirmatory methods rather than routine screening.
| Method | Target Adulterant | Reported Detection Limit |
|---|---|---|
| ¹H NMR (400–700 MHz) + multivariate analysis | Seed oils (sunflower, corn, palm) | ~5% v/v |
| ³¹P NMR + discriminant analysis | Refined and lampante olive oil | ~5% w/w |
| Low-field benchtop NMR (60 MHz) + chemometrics | Hazelnut oil | ~11–13% w/w |
| Direct analysis in real time time-of-flight mass spectrometry (DART-TOFMS) + LDA | Hazelnut oil | 6% (polar fraction), 15% (TAG fraction) |
| LC-TIMS-HRMS (4D metabolomics) | Refined olive oil, pomace oil | ~1% |
A good example is LC-TIMS-HRMS, which adds trapped ion mobility as a fourth separation dimension. That extra step boosts sensitivity and metabolome coverage, pushing detection down to around 1% for refined olive oil and pomace oil adulteration in a single run.
Regulatory Acceptance
Even with all that power, NMR and HRMS are not official primary control methods under IOC trade standards or EU regulations. Official compliance still depends on GC plus standard physicochemical and sensory methods. In the U.S., the USDA and FDA have not required these tools for routine olive oil compliance. Instead, specialized labs and research centers use them to support fraud investigations, build authenticity databases, and add evidentiary backing when standard tests raise red flags.
Validated ¹H NMR protocols based on ISO formats have been developed to detect refined hazelnut oil in olive oil blends, which shows these methods are moving closer to broader use.
Role in Workflow
NMR and HRMS are confirmatory and investigative tools, not front-line screeners. Labs turn to them when samples still look suspicious after GC and routine screening. If a sterol profile looks atypical or a triacylglycerol distribution doesn’t add up, the next step is often NMR or HRMS for a deeper check. Low-field unilateral NMR can screen sealed bottles non-destructively at roughly 10% adulteration. If structure-based testing still can’t settle origin, labs then move to traceability methods.
4. DNA-Based Authentication and Traceability
DNA authentication comes into play when chemistry can't settle cultivar or origin claims. It looks at trace DNA in the oil to check whether the contents match the label. That makes it useful for origin disputes and for spotting hidden blending with other plant oils.
Primary Authenticity Markers
These tests rely on two marker types. The main tools are SSR markers and SNPs for Olea europaea, which can verify single-cultivar claims. One SNP method discriminated 49 cultivars from olive oil samples.
DNA methods can also do more than identify cultivar. PCR barcoding and DNA metabarcoding can flag non-olive plant DNA in the oil. In one comparative study, a PCR-capillary electrophoresis assay detected soybean, rapeseed, sunflower, and hazelnut adulteration, including hazelnut cases that fatty-acid profiling missed.
Typical Detection Limit
Published methods have detected canola or sunflower adulteration at 5% or less. Bar-HRM reached 1% w/w canola, while qPCR detected 5% hazelnut and 10% almond.
In day-to-day lab work in the U.S., thresholds are often more conservative, around 5% to 10%. The reason is simple: DNA breaks down in stored, filtered, or heavily processed oils, so lab performance in practice may fall short of published results.
Role in Workflow
DNA testing works best as a targeted follow-up, not a front-line screen. Labs usually turn to it when a lot carries a single-cultivar or origin claim that chemical data alone can't verify, or when a suspicious sample needs plant-species confirmation.
In U.S. practice, that makes DNA a confirmatory tool rather than a primary compliance method. Refining and filtration can degrade DNA, so the method works best on fresh, minimally processed fresh harvest extra virgin olive oil. Heavily refined oils may not yield enough intact DNA for reliable results. When chemistry, sensory findings, and DNA point in the same direction, the evidentiary case is stronger.
5. Physicochemical Quality Indices and Official Sensory Panels
Physicochemical indices and official sensory panels are the first checks used in routine olive oil compliance. They’re fast, standardized, and good at spotting many signs of adulteration before labs need to move to pricier tests.
Primary Authenticity Markers
The main physicochemical markers - FFA, PV, K232, K270, and ΔK - show freshness, oxidation, and whether refined oil may have been blended in. In EVOO, high K270 and an abnormal ΔK are strong warning signs of refined-oil blending.
Many advanced quality programs also follow pyropheophytins (PPP) and 1,2-diacylglycerols (DAGs). These two markers tie closely to fraud detection:
- High PPP can point to heat exposure or refining
- Shifted DAG ratios can point to aging or refining blended into fresh EVOO
These chemical limits catch most poor-quality oils and many refined oils. Sensory panels step in where chemistry has blind spots.
Typical Detection Limits
Classical indices work well for gross adulteration and clear quality failures, but they’re less sensitive when blending stays below about 10%. PPP and DAGs help narrow that gap by flagging refined or aged oil at fairly low levels.
Controlled research shows why that matters. Oils adulterated with as little as 2.5% to 10% rancid or winey-vinegary oil still passed legal physicochemical limits - but trained sensory panels detected the defects every time. So even when the lab numbers look fine on paper, the oil can still fail where it counts: smell and taste.
That’s why sensory evaluation remains part of official grade classification.
Regulatory Acceptance
In the U.S., the rule for extra virgin status is direct: an oil must have a median of defects = 0 and a median fruitiness > 0. If an oil passes the chemistry tests but shows a sensory defect, it cannot be classified as extra virgin.
Put plainly, any median defect above zero disqualifies EVOO.
Some major U.S. buyers set even tighter limits. A recent USDA commodity specification lowered the thresholds to:
- FFA < 0.5%
- PV < 15 meq/kg
- K232 < 2.4
Role in Workflow
Physicochemical indices work as a fast screen for non-conforming oils. Sensory panels run alongside them as a separate check, picking up adulteration patterns that may still sit near the edge of chemical limits.
Together, they form the routine baseline before confirmatory testing begins.
These markers set the baseline for the authenticity details explained next.
Key Authenticity Markers Explained
These are the main markers labs use to check for adulteration and verify whether an oil fits an olive, seed, or refined profile. GC, spectroscopy, NMR, DNA, and sensory testing all look at these same markers, just from different angles and with different levels of detail.
Fatty Acid Markers
Oleic acid should be the main fatty acid in olive oil. If linoleic or linolenic acid shows up at higher levels, that can point to blending with seed oils. Trans isomers are another red flag. They can signal refining or deodorization.
If fatty acids don't give a clear answer, labs usually move to sterols and triacylglycerols for a closer check.
Triacylglycerol and Sterol Markers
ΔECN42, campesterol, brassicasterol, Δ7-stigmastenol, and stigmastadienes help labs tell virgin olive oil apart from blends that include seed oil or refined oil.
UV Absorption and Oxidation Markers
Oxidation markers matter because adulteration often leaves behind a refining or storage fingerprint. In plain terms, even if an oil looks fine at first glance, its oxidation pattern can tell a different story.
| Marker | What It Measures | What a High Value Suggests |
|---|---|---|
| K232 | Primary oxidation products (conjugated dienes) | Significant oxidation or poor storage |
| K270 | Secondary oxidation products; refined oil byproducts | Advanced oxidation or refined oil blending |
| ΔK | UV spectrum irregularities from refining | Blending with refined or deodorized oil |
| Peroxide Value (PV) | Lipid hydroperoxides, the primary products of oxidation | Oxidative deterioration |
The next table shows how these markers line up with each detection method and reporting standard.
Comparison Tables: Detection Methods and Reporting
The tables below line up the main marker cutoffs, test speed, and reporting use. In plain English, they show how labs sort tests into screening, confirmation, and traceability work.
Table 1: Key Marker Parameters - Typical EVOO Limit or Range vs. Adulteration Signals
| Marker / Parameter | Typical EVOO Limit or Range | Adulteration / Non-Compliance Signal | Regulatory Reference |
|---|---|---|---|
| Free Fatty Acids (FFA) | < 0.5% as oleic acid | 0.8%–1.0% = virgin, not extra virgin; > 2.0% = lampante or non-compliant | USDA commodity spec; California standards |
| Peroxide Value (PV) | Low in fresh oil | Elevated = oxidation, poor storage, or possible fraud | IOC / USDA quality methods |
| K232 | ≤ 2.50 | Higher = significant oxidation or refining fingerprint | IOC official quality methods |
| K270 | ≤ 0.22 | Elevated = secondary oxidation or refined oil blending | IOC official quality methods |
| ΔK | ≤ 0.01 | Abnormal UV pattern = possible adulteration | IOC official quality methods |
| Pyropheophytin A (PPP) | 5%–17% | > 25% = heat-treated, aged, or deodorized/refined oil addition | USDA spec; California standards |
| 1,2-Diacylglycerols (DAGs) | ≥ 35% | < 30% = poor fruit quality, oxidation, or refined oil mixing | USDA spec; California standards |
| ECN42 (ΔECN42) | Within IOC category limit | Exceeds limit = seed oil addition or atypical TAG profile | IOC official method |
| Campesterol | Typically ≤ 4.0%; some IOC rules allow 4.0%–4.5% | Higher = possible seed oil addition | IOC / Codex decision rules |
| Δ7-Stigmastenol | Within category limits | Elevated = non-olive oil admixture or pomace contamination | IOC / Codex decision rules |
| Brassicasterol | Low; within IOC limits | Unusually high = rapeseed or canola oil present | IOC / EC standards |
| Waxes (pomace/refined oil marker) | Often ≤ 250 mg/kg, category-dependent | Elevated = pomace or refined oil components | IOC standards |
A few of these markers act like quick warning lights. FFA, PV, K232, K270, and ΔK help flag oxidation, rough handling, or refining patterns. Others, such as PPP, DAGs, sterols, ECN42, and waxes, help labs decide whether an oil has been mixed, overheated, deodorized, or pushed out of its declared grade.
Table 2: Spectroscopy Methods - Speed, Prep, Detection Limits, and Best Use
| Method | Speed | Sample Prep | Typical Detection Limit | Best Use |
|---|---|---|---|---|
| FTIR | Seconds to minutes | Minimal; often a drop or small cuvette | As low as 0.5%–1% v/v in controlled studies; low single-digit % with chemometrics | Rapid screening; high-throughput QC |
| NIR | Seconds to minutes | Minimal | About 10%–20% in general studies; better with calibration models | High-throughput lot screening |
| UV-Vis | Fast (minutes) | Direct or simple dilution | Often around 10% for many adulteration scenarios | Oxidation checks; targeted quality control |
| Fluorescence | Fast (minutes) | Minimal to simple dilution | Often around 10% for standalone screening; advanced chemometric or neural-network models can substantially improve classification accuracy | Age/oxidation screening; dual-use QC |
| Raman | Moderate | Careful alignment needed | Low single-digit % with chemometrics | Confirmatory screening in advanced labs |
Spectroscopy is where speed matters. FTIR and NIR are often the first pass because prep is light and results come fast. UV-Vis and fluorescence are handy for oxidation and age-related checks, while Raman can push into a stronger screening role in labs that have the gear and model support.
When chemistry is inconclusive, NMR and HRMS add confirmatory detail.
Table 3: NMR vs. LC-MS - Sample Requirements, Key Markers, Detection Limits, and Cost
| Criteria | NMR (¹H or ¹³C) | LC-MS / LC-HRMS |
|---|---|---|
| Sample Requirements | Neat or lightly prepared oil; minimal extraction | Solvent extraction, clean-up, and chromatographic separation required |
| Key Markers | Triglyceride patterns, minor components, oxidation signatures | Specific marker compounds (unusual TAGs, phenolic fingerprints, non-olive plant markers) at low concentrations |
| Detection Limit | About 5% to 13% w/w depending on the model | ppm to ppb level for targeted adulterant markers |
| Cost / Complexity | High capital cost; fast throughput once set up; expert spectral interpretation needed | High capital and operating cost; complex data analysis; fragmentation pattern expertise required |
| Best For | Routine authenticity profiling in advanced labs | Confirmatory, forensic analysis; regulatory investigations |
This is where the work gets more exact. NMR is useful for pattern-level profiling with limited prep, while LC-MS / LC-HRMS can chase very low-level marker compounds down to the ppm to ppb range. If spectroscopy says, “something looks off,” these methods help show what is off.
Table 4: DNA-Based Methods - Primary Use and Sensitivity
| Method | Primary Use | Typical Sensitivity | Practical Notes |
|---|---|---|---|
| DNA Barcoding | Species authentication (olive vs. non-olive) | Limited by DNA degradation in processed oils | Most reliable when the adulterant contains intact or partially intact DNA |
| SSR-HRM | Monovarietal authentication; cultivar discrimination | Low percent levels when sufficient DNA quality is recovered | Short amplicons; uses melting curve differences |
| SNP-HRM | Blend verification; distinguishing adulterated oils | Low percent levels; complementary to SSR-HRM | Better suited for blend and adulteration detection than SSR-HRM |
| qPCR (TaqMan) | Quantitative detection and estimation of specific adulterant DNA | Sub-nanogram DNA; fractions of a percent in some assays | Most sensitive DNA method for quantitative adulteration assessment |
DNA methods answer a different kind of question. Instead of asking whether the oil’s chemistry looks strange, they ask whether the biological source matches the label. That matters for species checks, cultivar claims, and low-level adulterant tracing when enough DNA survives processing. Among these tools, qPCR (TaqMan) is the most sensitive for quantitative adulteration assessment.
These thresholds feed straight into how labs classify and report adulteration.
How Labs Interpret and Report Adulteration Results
Thresholds by themselves don't say much. They only become useful when a lab ties each result to a stated standard and a plain decision. A good adulteration report should spell out what was tested, how it was tested, and whether the sample met the standard. At a minimum, the report should include sample ID, test purpose, method and standard, instrument and conditions, markers, results, uncertainty, LOD/LOQ, precision, and a final interpretation so buyers or compliance teams can read the findings in context.
For spectroscopy and chemometrics, the report should also show the spectral preprocessing steps used before analysis. That includes baseline correction, normalization, smoothing, or derivative treatment. If a lab uses a chemometric model, it needs to explain how that model was built and checked. In plain terms, the report should name the model type, the calibration and validation sets, and key performance figures such as accuracy, sensitivity, specificity, and classification error.
ISO/IEC 17025-accredited labs usually note which tests are covered by their accreditation scope and report measurement uncertainty at 95% confidence. That matters because it shows where the lab's formal approval applies. For example, AOAC SMPR 2020.010 sets LOQ ≤ 10%, recovery of 80%–120%, and RSDr ≤ 10%.
The final call - authentic, suspect, or adulterated - should always point back to named evidence. If a sterol profile falls outside accepted IOC limits, the report should say so. If a spectral pattern matches known adulterated training samples, that should be named as the reason for the decision. Sensory reports should list panel composition, defect median, fruitiness median, and the final grade.
Accredited labs usually write these reports for two main uses:
- Compliance testing: The report shows whether a product meets IOC, Codex, EU, or U.S. buyer and regulatory expectations.
- Label verification: For programs such as the North American Olive Oil Association Certified Seal program, the report shows whether the label grade is backed by the analytical evidence.
That's the framework that turns raw marker data into a defensible authenticity call.
Conclusion
The strongest authenticity programs use each test for what it does best. GC, spectroscopy, NMR, and DNA don’t all answer the same question. Each one checks a different part of the picture. Put them together, and testing moves from a simple screen to defensible evidence.
For U.S. producers, importers, and retailers, standards-based testing that lines up with IOC, Codex, and USDA frameworks helps support defensible compliance results and truthful labeling. In practice, those claims need backing from independent laboratory analysis.
Reference libraries, benchtop NMR, and chemometric models are improving detection. When labs use these tools together, they can classify oil more accurately, support compliance, and protect label integrity.
FAQs
Why can’t one test confirm olive oil adulteration?
No single test can confirm olive oil adulteration. Olive oil already has a broad range of chemical traits, and fraud methods keep getting more sophisticated.
That creates a messy problem. An adulterant can look a lot like the real thing, and poor storage can make a genuine oil show warning signs that seem like tampering.
So experts don’t lean on just one check. They use multiple tests, including sensory, chemical, and spectroscopic analysis.
Which adulterants are hardest for labs to detect?
Adulterants that are chemically close to olive oil are often the toughest to spot, especially hazelnut oil. It looks so similar in triacylglycerol profiles and phenolic compounds that standard methods like GC/MS can miss it.
Soft-deodorized oils refined at low temperatures can slip past conventional testing too. Their composition changes only a little, which means labs often need more advanced methods such as LC-HRMS or GC-IMS.
Can sensory testing catch fraud that lab numbers miss?
Sensory testing is the first line of defense. Trained panels can quickly spot defects like rancidity, fustiness, or mustiness that may point to problems before formal lab testing starts.
That said, sensory testing is subjective. And it can miss subtle adulteration that doesn’t cause a clear change in flavor.
That’s why sensory analysis is used alongside GC/MS or NMR spectroscopy for more complete authenticity testing.