

Checklist for Olive Oil Authenticity Testing
If you want a sound olive oil check, isotope data is only one part of the job. I’d use it to screen for mixing with other oils and to test whether a claimed origin fits the oil’s isotope pattern, but I would not use it alone to make the final call.
Here’s the short version:
- I start with the sample, because bad sampling can spoil the whole result.
- I record full metadata like harvest year, cultivar, region, lot ID, and storage details.
- I use IRMS to measure δ¹³C, δ²H, and δ¹⁸O.
- I treat δ¹³C as the main check for blending and δ²H/δ¹⁸O as the main check for origin.
- I move to GC-IRMS if bulk results are unclear.
- I only accept data if calibration, duplicates, and control checks pass.
- I compare the result with a reference set built from more than one harvest year.
- I back up isotope findings with acidity, peroxide value, UV indices, sterols, waxes, TAG tests, spectroscopy, and sensory review.
A few numbers matter right away. The article notes 3–5 unopened bottles for packaged oil, 50–100 mL minimum sample volume, and 250 mL preferred. Storage should stay at 32–41°F (0–5°C). For repeatability, the stated 2-sigma targets are ≤0.3‰ for δ¹³C, ≤0.5‰ for δ¹⁸O, and ≤3‰ for δ²H.
There are also hard limits. Bulk screening may miss low-level mixing when isotope ranges overlap. One cited study found 5% added vegetable or hazelnut oil through compound-specific fatty acid work, while refined hazelnut oil by pyrolysis-IRMS was picked up with confidence only above about 10%. And year-to-year weather shifts can move isotope values enough to blur origin calls.
So if I had to sum up the whole piece in one line, it would be this: use isotope testing as a screening and decision-support tool, not as the only proof.
That sets up the rest of the article: sample well, document everything, run the right isotope method, validate the data, and then read the result next to chemistry and sensory checks before making a decision.
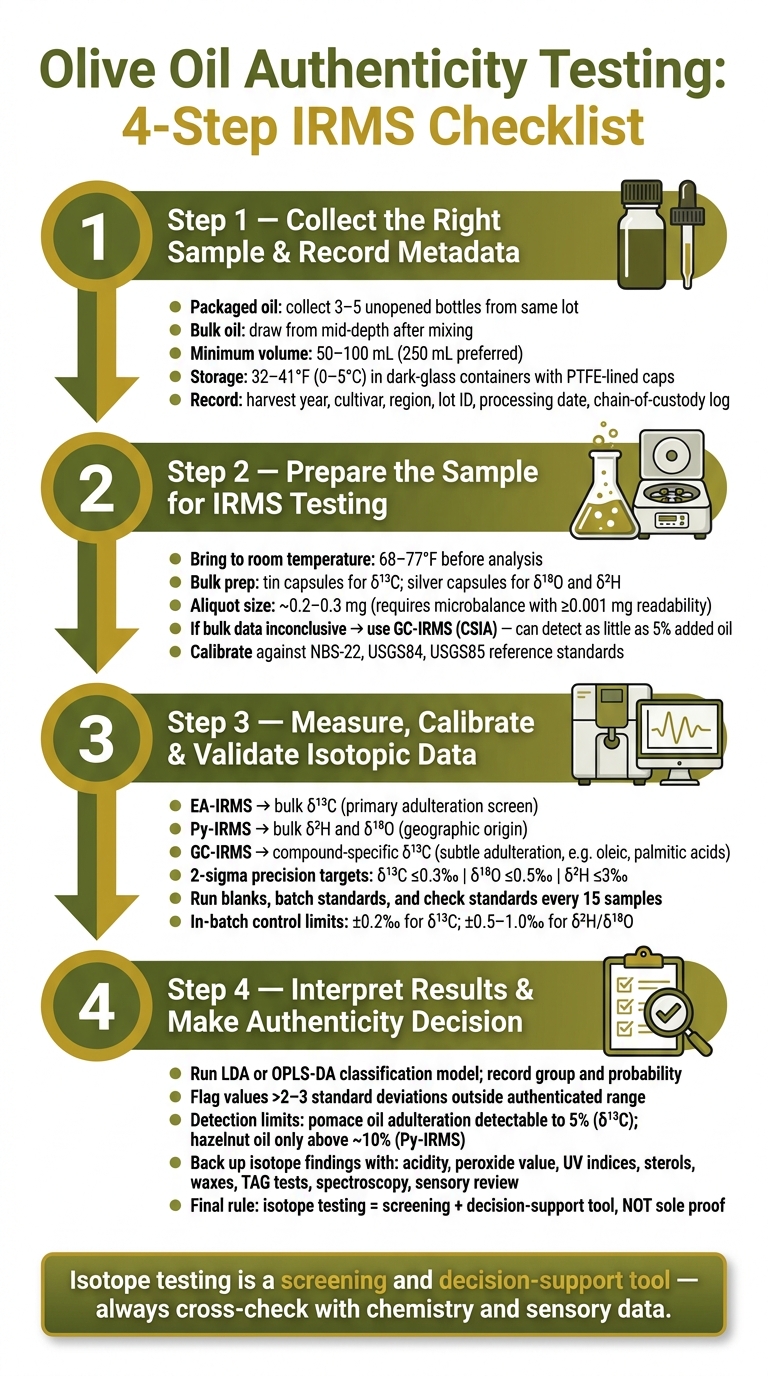
Olive Oil Authenticity Testing: 4-Step IRMS Checklist
Step 1: Collect the Right Sample and Record Complete Metadata
Before IRMS testing starts, the sample has to be right. If sampling is poor, even a very precise IRMS result can fall apart.
Sampling and Storage Conditions
Use a sample that actually represents the lot being checked for adulteration or origin. If the sample is off, the isotope data will be off too.
For packaged oils, collect 3–5 unopened bottles from the same lot. You can test them one by one or combine them into a composite sample under controlled conditions.
For bulk oils stored in tanks or drums, mix the oil well first with clean, inert equipment. Then draw the sample from mid-depth. That helps you avoid oxidized oil at the surface and sediment near the bottom.
For storage and transport, use dark-glass containers with PTFE-lined caps. Keep headspace as small as possible, and flush with nitrogen if needed. Store samples at 32–41°F (0–5°C) to slow oxidation without freezing them. During transport, use insulated coolers with ice packs.
Collect at least 50–100 mL of oil. If possible, send 250 mL, which gives the lab enough material for repeat testing and retention.
Documentation and Chain of Custody
Metadata gives isotope results meaning. Without it, origin and harvest-year interpretation gets shaky fast.
At a minimum, record:
- Harvest year
- Cultivar such as Arbequina, Koroneiki, or Picual
- Production region and country
- Processing date such as crush date or bottling date
- Storage conditions
- Declared grade
- Lot or batch ID
- Sampling date and location
The chain-of-custody log should show every handoff. That includes who collected the sample, when and where it was collected, how it was sealed, how it was stored at each stage, and any problems along the way, such as a temperature excursion or a broken seal.
If harvest year or origin data is missing, geographic and vintage interpretation becomes much weaker.
Pre-Analysis Sample Intake Checklist (Table)
Use this table to confirm the sample is ready before it enters the lab. If any critical item is missing, fix it before the sample moves forward.
| Item | Why It Matters | Minimum Documentation |
|---|---|---|
| Sample ID and lot/batch ID | Links the tested sample to a specific commercial lot for traceability and dispute resolution | Labeled code on container matching the submission form |
| Container type and condition | Dark glass limits oxidation and contamination; damaged containers compromise integrity | Intact, sealed dark-glass container with no leaks or cracks |
| Sample volume | Sufficient volume is needed for analysis, repeats, and archival retention | ≥50 mL (250 mL preferred for full testing and retention) |
| Storage temperature during transport | Elevated temperatures can accelerate degradation and complicate interpretation | Statement of 32–41°F maintenance, or a temperature log |
| Harvest year (vintage) | Required to match isotopic data to climate baselines and detect age-related blending | Documented year on submission form or product label |
| Production region and country | Geographic origin is the primary variable in isotopic origin verification | Specific region and country, not just a broad label |
| Cultivar or varietal blend | Varietal composition can influence fatty acid profiles and typical isotopic ranges | Named cultivar(s) or blend description |
| Processing and bottling date | Ties the sample to a defined production event; helps flag vintage blending | Date on form or producer documentation |
| Storage conditions | Affects sample integrity and isotopic stability during transit | Documented storage method and temperature log |
| Chain-of-custody log | Ensures the sample tested is the same product being evaluated and supports legal defensibility | Signed or authenticated record of each transfer from collection to lab intake |
With a verified sample and complete metadata, move to IRMS preparation.
sbb-itb-4066b8e
Step 2: Prepare the Olive Oil for IRMS Testing
Once the sample is verified and the metadata is complete, it’s time to get it ready for the lab. Bring samples to room temperature, 68–77°F, before analysis. Then mix them gently by vortexing, stirring, or repeated inversion. Skip aggressive shaking. It can create air bubbles and speed up oxidation.
Start with bulk preparation. Move to fraction-specific prep only if the bulk data doesn’t give a clear answer.
Bulk Isotope Preparation
Weigh the aliquot straight into the right capsule. Use tin capsules for δ¹³C and silver capsules for δ¹⁸O and δ²H. These aliquots are often tiny, around 0.2–0.3 mg, so you need a calibrated microbalance with at least 0.001 mg readability.
After weighing, keep samples dry and sealed. For δ¹⁸O and δ²H work, use desiccation and a nitrogen purge. At this stage, small handling mistakes can throw things off fast.
Compound-Specific Preparation for Fatty Acids or Fractions
Use CSIA via GC-IRMS when bulk data is inconclusive or adulteration still looks likely. This is where you go from “something seems off” to “here’s where the problem is.”
A 2025 authenticity study found that CSIA of individual fatty acids can detect as little as 5% added vegetable or hazelnut oil in olive oil samples. That’s a small amount, which is why this step matters when basic screening isn’t enough.
Convert the target fraction to FAMEs by transesterification. Then check purity with GC-FID before moving to GC-IRMS. If you need sterol fractions, use preparative chromatography to isolate compounds such as β-sitosterol, then confirm purity before analysis.
Log every prep detail as you go so the calibration and validation work in Step 3 can be traced back to each sample.
Reference Standards and QC Checks
Calibrate IRMS data against certified reference materials on international isotope scales. Use:
For olive oil testing, certified references such as NBS-22, USGS84, and USGS85 are appropriate. Calibrate in-house working standards against those materials before using them.
QC should be steady and routine, not an afterthought. Run blanks, batch standards at the start and end, and check standards every 15 samples. Run duplicates across the batch and aim for SD ≤0.2‰ for δ¹³C.
Also log every preparation record: capsule type, sample mass, reagent lot numbers, and drying time. Link each record to the sample ID from Step 1.
Step 3: Measure, Calibrate, and Validate the Isotopic Data
Once samples are prepared and logged, the next job is to measure, calibrate, and validate the isotope data. Keep each run tied back to the sample IDs, prep logs, and QC records from Step 2 so the full chain stays traceable.
Instrument Setup and Isotope Selection
Measure bulk δ¹³C with EA-IRMS. Measure bulk δ²H and δ¹⁸O with Py-IRMS. In practice, δ¹³C is the main screen for adulteration, while δ²H and δ¹⁸O help with origin checks. Use GC-IRMS only if the bulk data don't cleanly separate authentic oil from a suspected adulterated sample.
For adulteration screening, EA-IRMS can detect corn oil blending at 10% and soybean oil at 30% when δ²H and δ¹³C are used together. For origin work, δ¹⁸O showed statistically significant differences (p < 0.001) between Italian and non-Italian oils in one multi-season study, while δ¹³C and δ²H did not.
If the bulk results still sit in a gray area, add GC-IRMS and measure compound-specific δ¹³C for fatty acids such as oleic, palmitic, linoleic, and stearic acids.
Calibration and Repeatability Checks
Apply the calibration model defined during method setup, then check it with certified reference materials that span the expected olive-oil range. Use at least two certified reference materials for each isotope and apply multipoint normalization. Record the regression parameters, CRM lot numbers, and any corrections made.
The reported 2-sigma precision targets are:
- ≤0.3‰ for δ¹³C
- ≤0.5‰ for δ¹⁸O
- ≤3‰ for δ²H
Reject replicate sets that go past those repeatability limits. Also check that in-batch standards remain inside control limits - ±0.2‰ for δ¹³C and ±0.5–1.0‰ for δ²H/δ¹⁸O - before releasing any data.
No data should move forward to interpretation unless the standards, drift checks, and replicate limits are all in control. That's the gate. If one part misses, the run doesn't pass.
Isotopic Methods Compared by Use
| Method | Target Isotope(s) | Sample Type | Authenticity Use | Main Limitation |
|---|---|---|---|---|
| EA-IRMS | Bulk δ¹³C | Small weighed oil aliquot | Primary adulteration screen; carbon fingerprinting | Cannot resolve individual compounds; minor adulteration may be masked if δ¹³C values overlap |
| Py-IRMS | Bulk δ²H, δ¹⁸O | Bulk oil | Geographic origin and adulteration screening, including refined hazelnut oil above ~10% | Less compound-specific than GC-IRMS |
| GC-IRMS | Compound-specific δ¹³C, δ²H | FAMEs from transesterified oil | Subtle adulteration detection; regional origin discrimination beyond bulk data | More complex sample prep; less precise than bulk methods |
Once a run clears calibration and repeatability checks, you can read the isotope pattern against the origin and adulteration benchmarks in Step 4.
Step 4: Interpret the Results and Reach an Authenticity Decision
Adulteration and Origin Review
Once the run clears calibration and repeatability checks, the next job is simple in theory but careful in practice: classify the extra virgin olive oil and write down the result.
Use the validated reference set, the sample metadata, and the chemometric model together. Run the sample through a classification model such as LDA or OPLS-DA, then record both the assigned group and the classification probability.
At this stage, a few rules help keep the decision grounded:
- Flag any isotope ratio that falls more than 2–3 standard deviations outside the authenticated range for the declared origin.
- Flag samples that the model assigns to another origin or an adulteration class with high confidence.
- Give the most weight to cases where bulk, compound-specific, and model outputs all point in the same direction.
If the isotope data land close to the cutoff, or if the result clashes with the declared origin, move to the next section before making the call.
Limits, Uncertainty, and When to Add Other Tests
Isotopic analysis can be very useful, but it doesn't tell the whole story.
One big issue is year-to-year climate variation. Changes in rainfall and growing conditions can shift δ¹⁸O and δ²H from one harvest to the next. That means a threshold built from a single harvest year can wrongly tag a genuine oil from a drier or wetter season. To reduce that risk, reference datasets should cover several years.
There's also a geography problem. Areas with similar climates - something you see often across the Mediterranean basin - can produce overlapping isotopic signatures. When that happens, fine-scale origin claims, such as separating neighboring regions, become shaky if you rely on isotopes alone.
Detection limits matter as well. Pomace oil adulteration can be detected down to 5% using δ¹³C of the aliphatic alcohol fraction. Hazelnut oil adulteration in refined olive oil is only detected with confidence above about 10% with pyrolysis-IRMS.
When you run into these limits, bring in other tools before making the final judgment:
- Sterol tests
- TAG tests
- Spectroscopic tests
- Sensory tests
Conclusion: Key Steps for Reliable Authenticity Testing
Reliable authenticity calls depend on representative sampling, complete metadata, correct IRMS methods, and cross-checking the isotope result with other quality markers.
FAQs
Why isn’t isotope testing enough on its own?
Isotope testing is a strong way to check geographic origin, but it has limits. It can't spot trace contaminants. And its results can shift with the seasons and weather, which is why accurate reference databases matter so much.
It works best as one part of a broader approach. That usually means pairing it with chemical analysis for compliance and sensory evaluation to catch defects like rancidity, which isotope testing can't detect.
When should GC-IRMS be used instead of bulk IRMS?
Use GC-IRMS when you need to test specific compounds instead of the oil’s overall makeup. Bulk IRMS gives you a general isotopic fingerprint for the entire sample.
GC-IRMS separates and measures individual components. That makes it especially useful when you need to spot subtle differences in complex samples or look closely at individual fatty acids and other compounds.
How much can harvest year affect origin results?
Harvest year can have a big impact on origin results. Seasonal shifts and weather patterns can change the isotope ratios found in olive oil, which means the same region may look a little different from one year to the next.
That’s why accurate geographic identification depends on strong reference databases. Those databases need to reflect year-to-year variation so the testing method can separate normal seasonal change from actual differences in origin.