

Remote Sensing in Olive Orchard Water Use
I use orchard imagery to decide where to check - not how much to irrigate. Before changing a schedule, I check soil moisture, tree water status, and irrigation equipment. A hot canopy alone doesn’t prove that trees need more water.
Here’s how I put the data to work:
- Satellites: Track differences between irrigation blocks over the season.
- Drones: Inspect rows and individual tree crowns, with checks for soil, shadows, and image quality.
- Field readings: Confirm whether mapped stress comes from dry soil, uneven watering, or another problem.
- Water-use estimates: Combine weather, canopy cover, rainfall, and stored soil water to calculate irrigation depth.
- Flow measurements: Convert that depth into run time and check how much water reaches each block.
For scale, 1 inch of water over 1 acre equals about 27,154 gallons - before adjustments for irrigation losses. I keep estimated water use separate from <u>water actually delivered</u>, then repeat field checks to see whether the irrigation change worked.
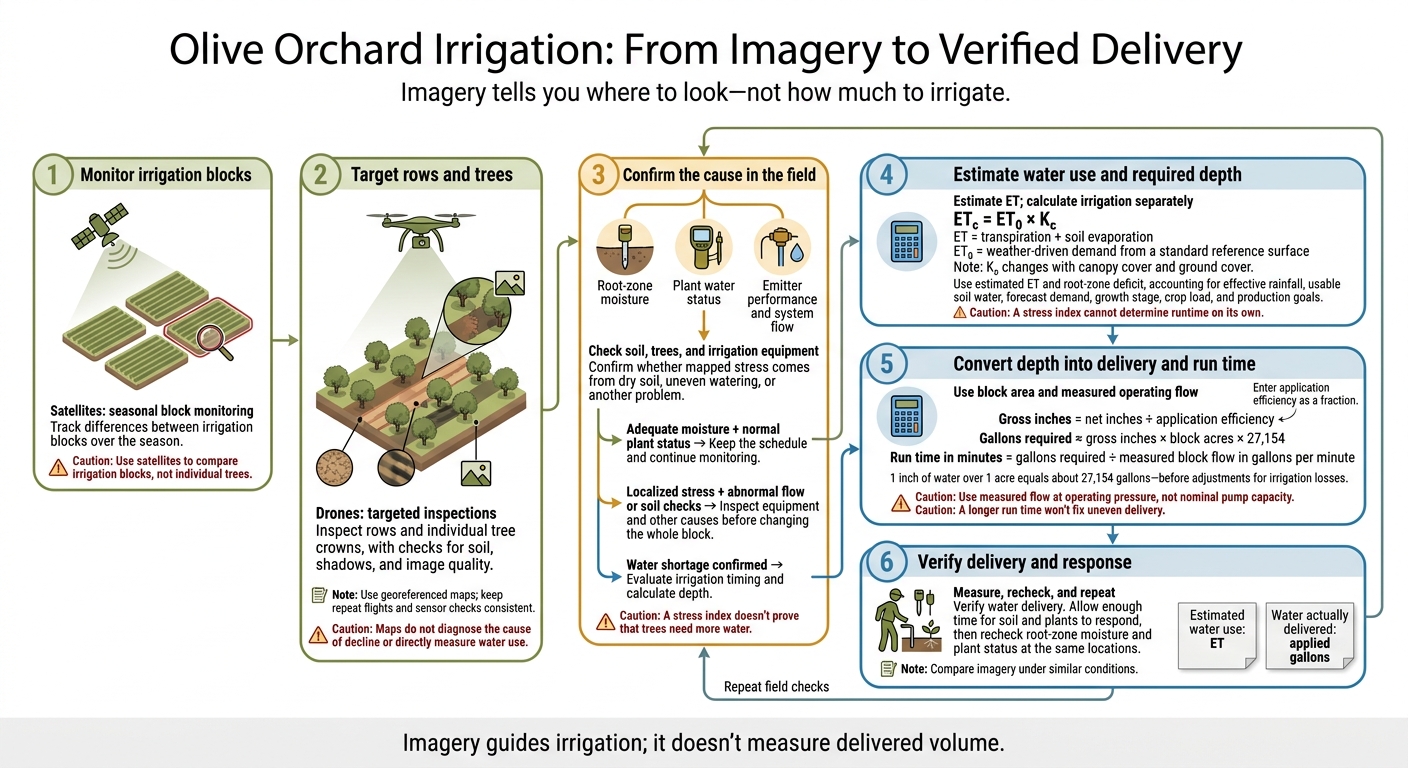
Olive Orchard Irrigation: From Imagery to Verified Delivery
Satellite and Drone Data for Olive Orchards
Satellite Images for Seasonal Monitoring
Start with satellite maps to spot uneven blocks, then check the flagged trees in the field. Multispectral and thermal imagery help track canopy vigor and surface temperature through the season. Read those patterns alongside weather data and ET₀.
Check the imagery’s spatial resolution and revisit interval. Clouds, haze, and shadows can delay usable images. Use satellites to compare irrigation blocks, not individual trees.
Once satellite images flag a problem area, drones can narrow the search to a row or tree.
Drone Surveys for Tree-Level Checks
RGB imagery shows missing trees, canopy gaps, and exposed ground. Multispectral and thermal cameras add vegetation and temperature patterns. SfM uses overlapping photos to estimate canopy height and crown size.
Request georeferenced maps aligned to geographic coordinates so the layers match orchard rows. Good flights can separate individual crowns from surrounding soil, helping you target field checks of stressed trees and irrigation equipment. But these maps do not diagnose the cause of decline or directly measure water use.
For repeat flights, keep altitude, flight lines, overlap, and sensor settings consistent. Fly at similar times of day and in similar weather when possible. Record weather, recent rainfall, and irrigation timing. Use reflectance-panel calibration for multispectral sensors and appropriate thermal quality checks. Budget time for processing and map review - not just the flight.
Choosing Satellite or Drone Coverage
Use satellites for routine block monitoring and drones for targeted inspections of local problems and differences within blocks.
| Factor | Satellite coverage | Drone coverage |
|---|---|---|
| Coverage | Broad orchard coverage | Selected blocks, rows, or individual trees |
| Resolution | Depends on the product; mixed canopy-and-soil pixels can limit detail | Depends on the flight and sensor; good flights resolve individual crowns |
| Scheduling | Satellite passes and cloud conditions determine availability | Planned timing, subject to weather and operating limits |
| Sensors | Multispectral; thermal on some platforms | RGB, multispectral, thermal; overlapping photos support SfM |
| Processing | Established platforms can support routine comparisons | Requires flight planning, calibration, mapping, and quality checks |
| Limitations | Clouds, observation gaps, mixed pixels | Batteries, weather, operator skill, calibration |
| Irrigation use | Prioritize blocks for field checks | Target field checks within rows and around individual trees |
Compare the total workflow cost, including processing, interpretation, and field validation - not image acquisition alone.
Imagery tells you where to look; field checks determine whether irrigation changes are justified. Soil depth, root-zone moisture, emitter performance, system flow, and the orchard’s water-management strategy still determine whether, when, and how long to irrigate.
sbb-itb-4066b8e
Assessing Water Stress and Water Use
Reading Canopy Temperature and Vegetation Indices
Water stress can reduce stomatal opening. That slows transpiration and warms the canopy. CWSI (Crop Water Stress Index) compares this temperature response with wet and dry references. Higher values generally mean greater stress, but humidity, wind, radiation, and reference calibration also affect the result.
| Signal | Main use | Field checks | Key uncertainty |
|---|---|---|---|
| Canopy temperature | Find possible drops in transpiration | Compare air temperature, humidity, wind, and plant water status | Hot soil, shadows, disease, and thermal calibration can distort readings |
| CWSI | Express relative thermal stress | Verify wet/dry references; check soil moisture and stem water potential | Depends on weather; does not specify irrigation depth |
| GNDVI: Green Normalized Difference Vegetation Index | Track vigor and chlorophyll-related changes using green and near-infrared bands | Check nutrition, disease, pruning, and canopy density | Nutrient shortages, soil background, and shadows can resemble drought |
| NDRE: Normalized Difference Red Edge Index | Track chlorophyll-related differences, including in dense foliage | Confirm calibrated red-edge and near-infrared bands; check plant status | Sensor-band availability, canopy structure, and illumination affect results |
| Moisture-sensitive indices | Screen for changes in vegetation water content | Confirm the formula and required bands; compare with soil moisture and plant water status | Some require shortwave-infrared bands; exposed soil and atmospheric correction matter |
Hot spots that recur across dates can flag likely stress. Use those map patterns to choose soil and plant sampling points, then confirm the cause before changing irrigation.
Checking Root-Zone Moisture and Plant Water Status
Pair canopy stress signals with root-zone and plant measurements. Soil readings show the water supply; plant readings show how the tree responds.
Interpret moisture percentages by soil texture. The same percentage does not mean the same water availability in sand and clay. Sample across irrigation zones, soil types, slopes, and canopy densities. Place sensors at several active rooting depths and at different points within the emitter’s wetted pattern.
For stem water potential, keep cultivar, leaf age, canopy position, midday timing, and bagging procedure consistent. Read the results alongside weather conditions rather than relying on one threshold for every situation.
| Measurement | What it measures | Coverage and timing value | Limitations |
|---|---|---|---|
| Volumetric soil-moisture probe | Water volume per soil volume, often as a percentage | Tracks wetting and drying continuously within a small sampled volume | Texture, salinity, calibration, and placement affect readings |
| Soil-water-potential sensor | How strongly the soil retains water, in kPa or MPa | Shows how tightly the soil holds water | Needs good soil contact and a suitable measurement range |
| Spot soil sampling | Water content, texture, salinity, or other laboratory properties | Covers selected locations and depths; useful for validating probes | Labor-intensive snapshot, not continuous monitoring |
| Stem water potential | Plant water status measured with a pressure chamber, in MPa | Covers selected trees; standardized midday checks help confirm stress | Requires trained staff; weather, cultivar, crop load, and growth stage affect results |
These field readings help determine whether mapped stress reflects an actual water shortage.
Estimating Evapotranspiration
Evapotranspiration (ET) combines transpiration and soil evaporation. Reference ET, ET₀, describes weather-driven demand from a standard reference surface. For weather-based estimates, use ETc = ET₀ × Kc. Dual-coefficient methods separate transpiration from soil evaporation. In olive orchards, Kc changes with canopy cover and ground cover.
Thermal energy-balance models use thermal and multispectral imagery to estimate actual fluxes. They require proper timing, correction, calibration, and clear separation of canopy and soil.
Applied irrigation requires a separate calculation. Subtract effective rainfall and usable soil water from ET, then adjust for system efficiency. Convert that depth to runtime using zone area, measured flow, and distribution uniformity. A stress index cannot determine runtime on its own. These depth estimates feed the irrigation zones and runtimes in the next step.
Talk #7: Optimized Irrigation Management in Olive with Giulia Marino
Scheduling Irrigation With Field-Checked Maps
Use estimated ET and root-zone deficit to make irrigation decisions for each block.
Turning Images Into Irrigation Zones
Use maps to guide inspections - not to trigger irrigation automatically. Base zones on differences confirmed in the field and the valves that control water delivery.
Start by mapping orchard blocks to their valves. Include soil type, slope, drainage, and salinity issues. For each image, record the date, time, weather, calibration, and processing settings. Choose images that fit the block scale and allow comparisons across dates.
Compare the maps with root-zone soil-moisture readings, plant-water-status checks, rainfall, irrigation records, measured flow, and root-zone deficit. Group only persistent differences into zones.
Before changing a schedule, inspect suspect areas for blocked emitters, leaks, weeds, disease, compaction, or shade, and make repairs where needed. After irrigation, reimage or resample the same locations. Use these field-checked zones to guide timing and run time.
Setting Irrigation Timing and Run Time
| Combined evidence | Next action |
|---|---|
| Canopy indicators are stable, root-zone moisture is adequate, and plant status is normal | Keep the schedule and continue monitoring. |
| Canopy stress increases, root-zone moisture drops, and plant status confirms stress | Consider irrigating earlier, accounting for the forecast, growth stage, system capacity, and net-depth calculations. |
| A small area is stressed while nearby areas are normal, and flow or soil checks are abnormal | Inspect emitters, filters, pressure, leaks, valves, and block uniformity before changing the whole block. |
| Low NDVI with normal moisture | Check canopy density, weeds, disease, pruning, or shadows - not irrigation need. |
| Thermal stress appears while root-zone moisture stays steady | Check image timing, wind, cloud or haze, canopy cover, sensor calibration, and plant or soil heterogeneity. |
Set timing and depth separately. Calculate net depth from root-zone deficit and expected ET, accounting for forecast demand, rainfall, growth stage, crop load, and production goals. Then adjust for application efficiency and irrigation-window limits.
Convert that depth into the amount of water to deliver and the run time:
- Gross inches = net inches ÷ application efficiency
- Gallons required ≈ gross inches × block acres × 27,154
- Run time in minutes = gallons required ÷ measured block flow in gallons per minute
Use measured flow at operating pressure, not nominal pump capacity. Check distribution uniformity, too: a longer run time won't fix uneven delivery.
Checking Data Quality and Irrigation Response
Keep a record for each block that includes map versions, image dates and times, sensor locations and depths, weather, calibration, processing settings, run times, pressure, flow, and applied gallons. Compare maps taken under similar conditions. Use only blocks where canopy signals aren't mixed with soil or shadow. A localized anomaly does not justify an orchard-wide change.
After irrigation, verify water delivery. Allow enough time for the soil and plants to respond, then recheck root-zone moisture and plant status at the same locations. Track applied gallons separately from estimated ET. Use those same locations and similar conditions for the next check so you can compare the response directly.
Conclusion: Pair Imagery With Field Checks
Satellites track orchard patterns over time. Drones add detail at the tree or row level. Canopy temperature and vegetation indices can flag stress, but field checks confirm its cause. Check hotspots against root-zone moisture, plant water status, and irrigation-system performance to determine whether trees need water or the system needs a repair.
ET estimates show orchard water loss. They help with scheduling but aren’t a stand-alone command to irrigate. Track delivered water separately using a flow meter, or calculate it from emitter discharge, emitter count, operating pressure, and run time. Imagery guides irrigation; it doesn’t measure delivered volume. Use imagery to direct checks, field data to confirm stress, and flow measurements to verify delivery.
FAQs
How often should I collect orchard imagery?
Satellite imagery is available every five days to help spot irrigation problems and check vegetation health. Add drone-based multispectral or thermal imagery for a closer, real-time view of canopy stress and orchard conditions.
Pair these images with continuous readings from ground-based soil moisture sensors and plant-based sensors. Together, they help you track your grove’s health and make precise, timely irrigation adjustments.
What should I do if imagery and soil readings disagree?
First, check your equipment’s accuracy. Inspect sensors monthly for physical damage, clean their surfaces, and confirm they’re properly calibrated. Compare sensor readings with manual field measurements to spot and fix calibration problems.
If readings conflict, verify the data before using it to guide irrigation. Unchecked readings can lead to poor irrigation decisions that harm orchard health and productivity.
How can I tell if irrigation changes are working?
Monitor both soil and trees. Soil moisture sensors help you check whether water reaches the root zone and whether your adjustments change how water soaks into the soil. Plant-based sensors measure leaf turgor, sap flow, and stem water potential to show whether trees have enough water.
Use satellite imagery and drone thermal or multispectral data to track canopy temperature and vegetation health. These tools help you spot and reduce stress across the orchard. Keep an eye on fruit growth and overall tree vigor, too.