

How Renewable Energy Lowers Olive Oil Carbon Footprint
Renewable power can cut a big share of olive oil emissions, especially in the grove and at the mill. I’d sum it up like this: switch electricity to solar, swap fossil heat for olive waste biomass, and use cleaner pumping for irrigation. Those moves target the parts of production that use the most energy.
Here’s the short version:
- Olive growing is the main source of energy use, with over 90% of total demand tied to grove work like fertilizer, irrigation, and diesel equipment.
- Solar power lowers electricity emissions sharply, with solar PV at about 37 g CO2-eq/kWh versus grid power at about 330 g CO2-eq/kWh in the Spain example.
- Olive pits and pomace can replace fossil heat, and some systems have cut climate impact from 2.21 to 1.74 kg CO2-eq per kg of oil.
- Solar irrigation helps at the farm level, where water pumping can add a lot of power use in intensive orchards.
- Life cycle assessment (LCA) is how producers measure these cuts from farm to shelf and back up carbon claims with records.
If you want the plain answer: cleaner energy changes the final footprint because energy source is one of the biggest factors producers can control. And for shoppers, that means a lower-emission bottle starts long before packaging or shipping.
What matters most is not just using less energy, but changing where that energy comes from.
Leading olive oil producer Spain turns to olive stones for fuel | REUTERS

sbb-itb-4066b8e
Where olive oil production generates the most emissions
Olive oil emissions pile up in a few energy-hungry parts of the supply chain. By far, the biggest share comes from the grove. Olive growing accounts for more than 90% of total energy demand across the supply chain. That’s the main pressure point, and it’s where cleaner power can make the biggest dent.
| Supply Chain Stage | Main Activities | Typical Energy Source | Relative Share of Supply-Chain Emissions |
|---|---|---|---|
| Olive Growing & Grove Operations | Fertilizer production, irrigation pumping, tractor fuel for harvesting and pruning | Natural gas for fertilizer production; grid electricity for irrigation; diesel for tractors | Very high - over 90% of total energy demand |
| Milling, Bottling & Storage | Fruit cleaning, grinding, malaxation, centrifugation, bottling lines, refrigeration | Grid electricity for equipment; biomass heat for some mills | Moderate - roughly 4.4% to 8.0% |
| Transport & Distribution | Moving olives to mills, shipping finished bottles to market | Diesel trucks | Low - approximately 1.3% to 1.6% |
Olive growing and grove operations
At the farm level, two inputs do most of the damage: synthetic fertilizers and irrigation.
Fertilizer production alone uses between 67 and 102.5 megajoules (MJ) of energy per 220 lbs (100 kg) of olives produced, and it depends heavily on natural gas. Irrigation adds another 50 to 55 MJ of electricity per 220 lbs of olives in intensive growing systems. On top of that, diesel tractors used for pruning and harvesting add more emissions.
Put simply, the grove is where most of the energy gets burned before the olives even reach the mill.
Milling, bottling, and storage
Once olives leave the grove, the mill becomes the next big energy user. Electricity powers cleaning equipment, grinders, and centrifuges. Heat is also needed during malaxation and storage.
The extraction system matters too. Continuous three-phase systems use up to 50% more energy than pressure-based systems. That’s a big gap for one process choice. Glass packaging also adds a meaningful share to the processing footprint, which means the bottle itself isn’t just a side detail.
Transport and distribution
Transport plays a smaller role than farming or milling, but it still adds fuel use that can be cut. Moving olives from grove to mill, then shipping finished bottles to market, accounts for about 1.3% to 1.6% of total energy use in the supply chain.
That share is low next to the grove, but it’s not zero. Every truck trip still carries an energy cost.
How renewable energy cuts emissions in olive oil production
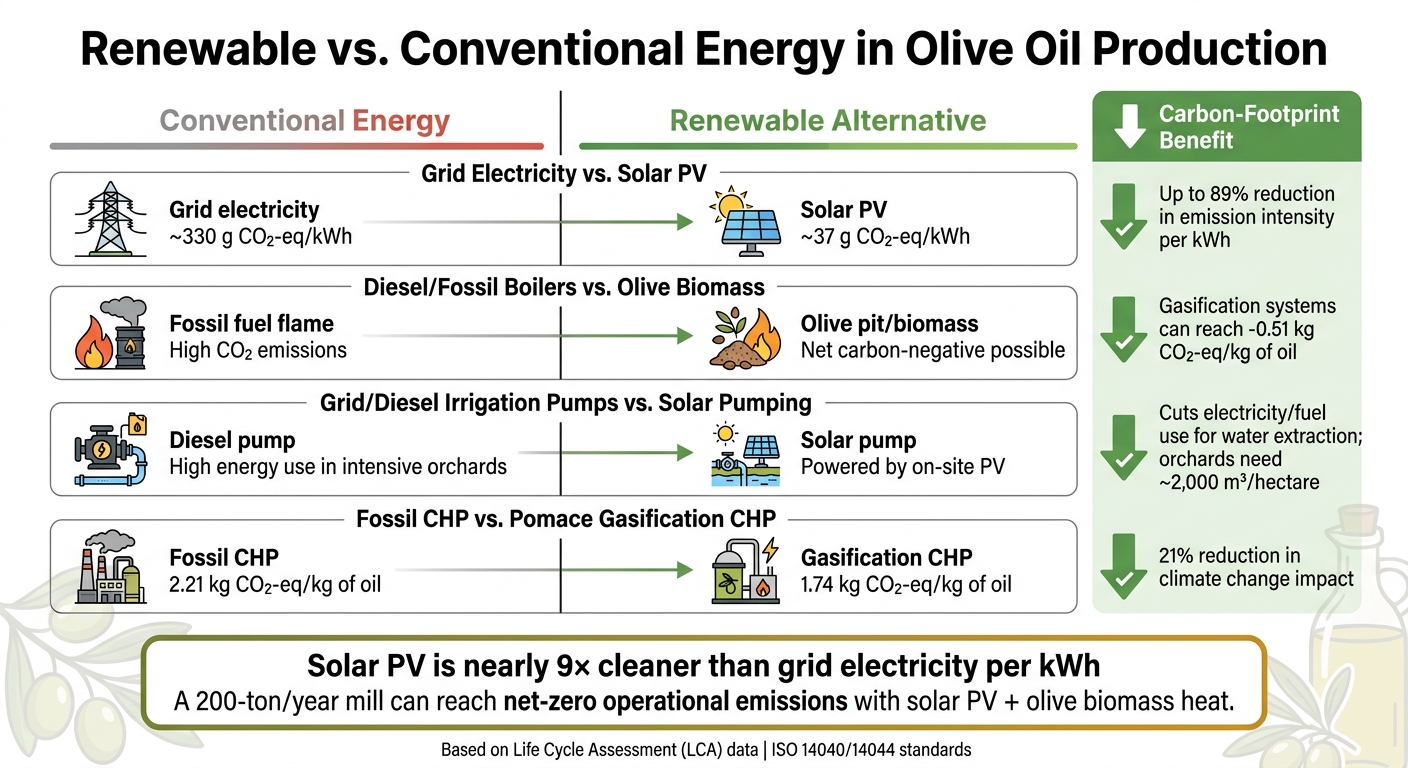
Renewable vs. Conventional Energy in Olive Oil Production: Carbon Footprint Comparison
Those hot spots are exactly where renewable energy can make the biggest dent in emissions.
| Conventional Energy Source | Renewable Alternative | Carbon-Footprint Benefit |
|---|---|---|
| Grid electricity (~330 g CO2-eq/kWh) | Rooftop solar PV (~37 g CO2-eq/kWh) | Reduces emission intensity by up to 89% per kWh |
| Diesel or fossil fuel boilers | Olive pits / pomace biomass | Can cut processing-stage emissions and, in gasification systems, turn production net carbon-negative (-0.51 kg CO2-eq/kg of oil) |
| Grid- or diesel-powered irrigation pumps | Solar-powered pumping systems | Cuts electricity or fuel use for water extraction in high-density orchards |
| Fossil-based combined heat and power | Pomace gasification (CHP) | Cuts climate change impact by 21%, from 2.21 to 1.74 kg CO2-eq per kg of oil |
Solar power for mills and storage
One of the biggest wins comes from replacing grid electricity at the mill. A mill uses power at almost every step, from fruit cleaning and grinding to centrifugal pumping, and rooftop solar can cover a big share of that load.
In Spain, grid electricity carries about 330 g CO2-eq per kWh, while solar PV lifecycle emissions come in at about 37 g CO2-eq per kWh. Put simply, solar is nearly nine times cleaner. Depending on the setup, PV can supply 11% to 84.7% of an olive mill's total energy use. Add battery storage, and the mill can use more of the power it generates on-site, cutting the carbon footprint by 22% to 119%.
A 2026 Crete study shows how far this can go. A mill producing 200 tons of oil per year reached net-zero operational emissions with solar PV plus olive biomass heat. The setup used a 13.33 kWp solar PV array and 9,524 kg of olive kernel wood per year for process heat.
Biomass from olive pits and mill waste
Olive mills also have another option sitting right in front of them: their own waste. Olive pits and pomace can be burned in biomass boilers or fed into gasification systems to make heat and electricity. That cuts fossil fuel use and also avoids emissions tied to hauling waste offsite.
On-site pomace gasification can generate both electricity and heat while cutting the oil's climate impact by 21%. In a 2022 integrated gasification project, the system processed pomace on-site and generated 0.88 kWh of renewable electricity per kg of olive oil produced. It also cut climate change impact from 2.21 kg CO2-eq to 1.74 kg CO2-eq per kg of oil, which made the industrial phase net carbon-negative.
Solar-powered irrigation and field systems
At the grove level, solar pumps can trim a major source of energy use: irrigation. High-density orchards may need about 2,000 cubic meters of water per hectare, so the electricity or diesel used to move that water adds up fast. Solar-powered pumping gives growers a direct way to cut that demand.
Field residues can help too. When pruning residues and pomace are used for bioenergy or compost instead of being burned or dumped, emissions drop. In Saudi Arabia's Al-Jouf region, repurposing 63.5% to 67.5% of orchard biomass for bioenergy and compost cut greenhouse gas emissions by 50% to 60% compared with open burning or dumping.
Taken together, solar irrigation and smarter use of residues can shrink the farm-stage footprint in a very practical way.
How life cycle assessment measures the impact of renewable energy
LCA turns olive oil emissions into a number you can track. It measures the carbon footprint from olive cultivation all the way through milling, bottling, and distribution. That step-by-step view shows where cleaner energy can make the biggest dent.
How the energy mix changes the final carbon footprint
The power source used at each stage changes the final result. LCA measures how much emissions drop when mills move to solar or biomass. The farming phase includes fertilizers, irrigation, and harvesting machinery. The milling phase includes electricity for grinding and centrifugation.
This is where LCA becomes useful in a very practical way. It shows where renewable power cuts emissions the most: milling, storage, and pumping. Lighter packaging can also trim transport emissions. And those figures matter because they shape the carbon claims shoppers see next.
What lower-carbon production means for shoppers
For consumers, a lower LCA score gives a clearer read on production emissions. When producers switch to renewable energy, they support lower-emission production and give shoppers clearer information about the carbon profile of what they buy. Those results also support certification, traceability, and clearer sustainability claims.
Certification, transparency, and quality-focused brands
Lower emissions matter more when someone can check the math. The next step is proving those numbers with records that can be tracked from start to finish. When producers log energy sources, waste handling, and carbon calculations, those figures can be reviewed and shared with shoppers in a clear way.
How renewable energy supports credible sustainability claims
LCA is the standard method used to verify environmental claims. It is carried out under ISO 14040 and ISO 14044 standards and helps guide decisions for both producers and buyers.
Producers can support their claims with hourly energy data and records that show how pomace and pruning waste are reused. For producers using biochar made from olive residues, the Verified Carbon Standard (VCS) offers a framework to document net carbon sequestration and soil carbon storage.
These checks turn renewable energy use into a claim that can be verified. The table below shows what each criterion reviews and where renewable energy makes a measurable difference:
| Sustainability Criterion | What Is Reviewed | How Renewable Energy Helps |
|---|---|---|
| Carbon Footprint (CF) | Life Cycle Assessment (LCA) following ISO 14040/14044 | Verifies emission cuts from solar or biomass power |
| Energy Transparency | Hourly energy consumption profiles and self-consumption ratios | Documents the share of mill energy covered by on-site renewables |
| Waste Valorization | Biomass utilization efficiency and circular resource recovery | Verifies that olive pomace and pits are reused as bioenergy or compost |
| Carbon Sequestration | Soil organic matter and carbon permanence factors | Documents long-term carbon storage in soil through biochar produced via pyrolysis |
Conclusion: How cleaner energy reduces olive oil's carbon footprint
That documentation is what makes sustainability claims believable at the shelf. Standardized reporting turns renewable energy use into a claim shoppers can trust.
FAQs
Why is olive growing the biggest source of emissions?
Olive growing generates the most emissions because the farming stage has the biggest impact in the olive oil supply chain. One major reason is the heavy use of inorganic fertilizers, which add a lot of indirect energy use.
Emissions also come from pesticides, water use, and fuel burned by machinery for soil management, harvesting, and pruning. In general, conventional orchards that rely more on chemical inputs and non-renewable energy produce higher emissions than organic systems.
Can olive waste really power an olive mill?
Yes. Olive waste such as pits, pomace, and wastewater can be turned into electricity and heat to help run an olive mill.
There are a few common ways mills do this:
- Burn solid biomass in boilers
- Use gasification for combined heat and power
- Turn pomace and wastewater into biogas through anaerobic digestion
The big upside is simple: this cuts fossil fuel use and lowers the mill’s carbon footprint.
How do producers verify a lower carbon footprint?
Producers usually verify a lower carbon footprint with a Life Cycle Assessment (LCA). This measures impacts across the full production process, often using a cradle-to-gate approach.
By comparing standard methods with renewable energy systems like rooftop solar or bioenergy, they can calculate cuts in CO2-equivalent emissions and track energy use with more precision.