

Carbon Footprint Standards for Olive Oil Explained
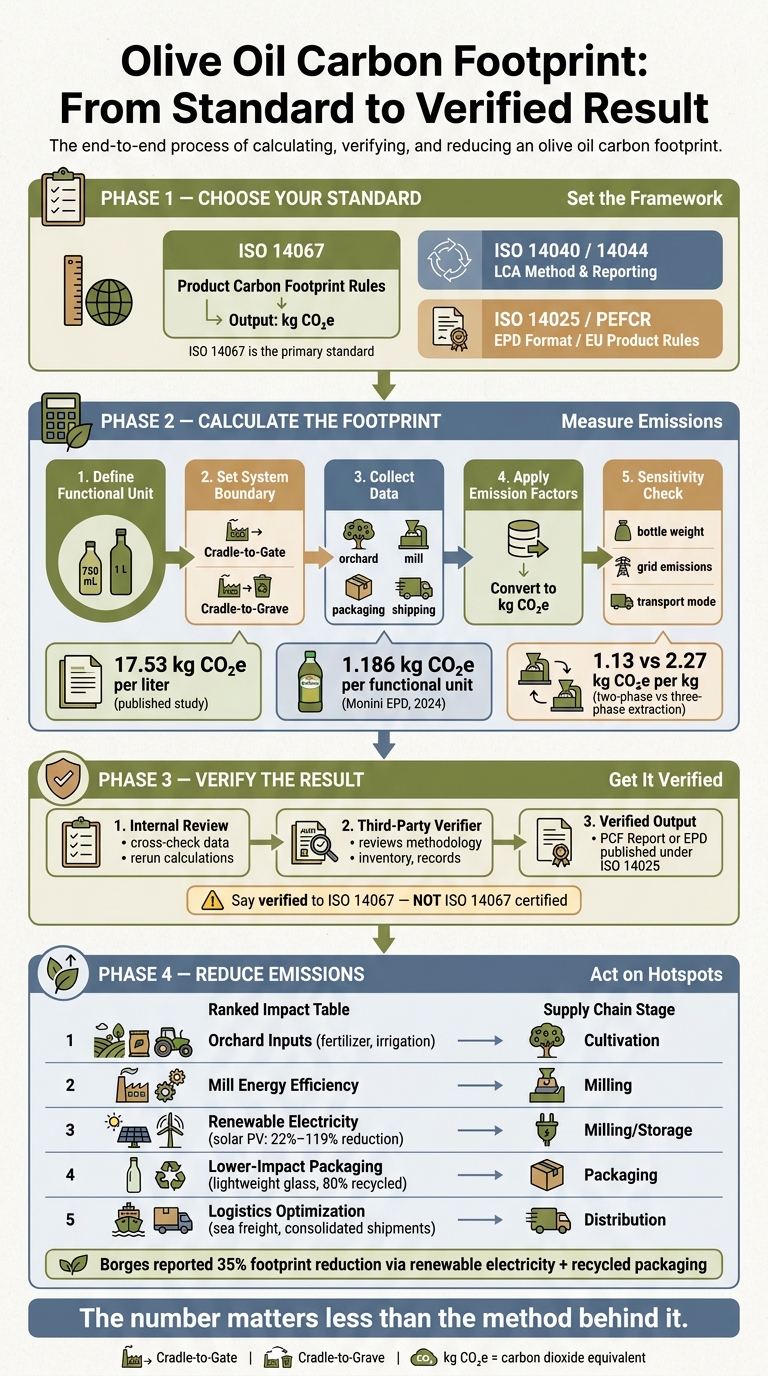
If you want an olive oil carbon number you can defend, you need three things: a clear standard, clean data, and outside review. In most cases, the main rule set is ISO 14067, backed by ISO 14040 and ISO 14044. The footprint is usually stated as kg CO₂e per liter or per bottle, and studies often show that farming is the main source of emissions - one study put it at 93.81% of the total, while another found distribution at 55%.
Here’s the short version:
- I start by choosing a functional unit, such as 1 liter or 750 mL
- I set the system boundary, usually cradle-to-gate or cradle-to-grave
- I collect data from the orchard, mill, packaging, and shipping
- I convert each input into kg CO₂e
- I review assumptions, records, and allocation choices
- I get the study verified to ISO 14067, not “ISO 14067 certified”
- I use the result to cut emissions in the biggest hot spots, like fertilizer, energy, glass, and freight
A few numbers show why this matters:
- 17.53 kg CO₂e per liter in one published olive oil study
- 1.186 kg CO₂e per functional unit in a 2024 EPD for Monini Extra Virgin Classic Oil
- 35% lower footprint reported by Borges after changes in electricity and packaging
- 1.13 vs. 2.27 kg CO₂e per kg of oil for two-phase versus three-phase extraction
- 22% to 119% reported change from solar PV, depending on study boundary and self-use rate
Quick comparison
| Item | What I use it for | Output |
|---|---|---|
| ISO 14067 | Product carbon footprint rules | PCF result in kg CO₂e |
| ISO 14040 / 14044 | LCA rules and reporting steps | Study method and review process |
| ISO 14025 | Published declaration format | EPD |
| PEFCR | EU product rules for olive oil | More aligned product comparisons |
If I had to boil the full topic down to one idea, it’s this: the number matters less than the method behind it. That’s the lens I’d use for any olive oil footprint claim.
Olive Oil Carbon Footprint: From Standard to Verified Result
Core Standards Behind Olive Oil Carbon Footprints
Three standards matter most in olive oil carbon footprint accounting: ISO 14067, ISO 14040, and ISO 14044. They fit together. First, you set the rules for the study. Then you choose the standard that lays out the method.
ISO 14067: The Primary Product Carbon Footprint Standard
ISO 14067:2018 is the main standard for measuring and reporting a product carbon footprint. In olive oil, that includes emissions from orchard work, milling, packaging, transport, storage, and distribution—factors we track closely in our story of sourcing authentic oil. Results are reported as kg CO₂e per functional unit, such as 1 liter of bottled olive oil.
The standard requires a clear goal, a defined functional unit, and a clear system boundary. It also asks you to state whether the footprint is full or partial. Just as important, it calls for clear records of assumptions, data quality, and calculation methods so a verifier can check the study against the standard. That kind of consistency makes it easier to spot where emissions are highest and where cuts may matter most.
ISO 14040 and ISO 14044: The Life-Cycle Assessment Foundation
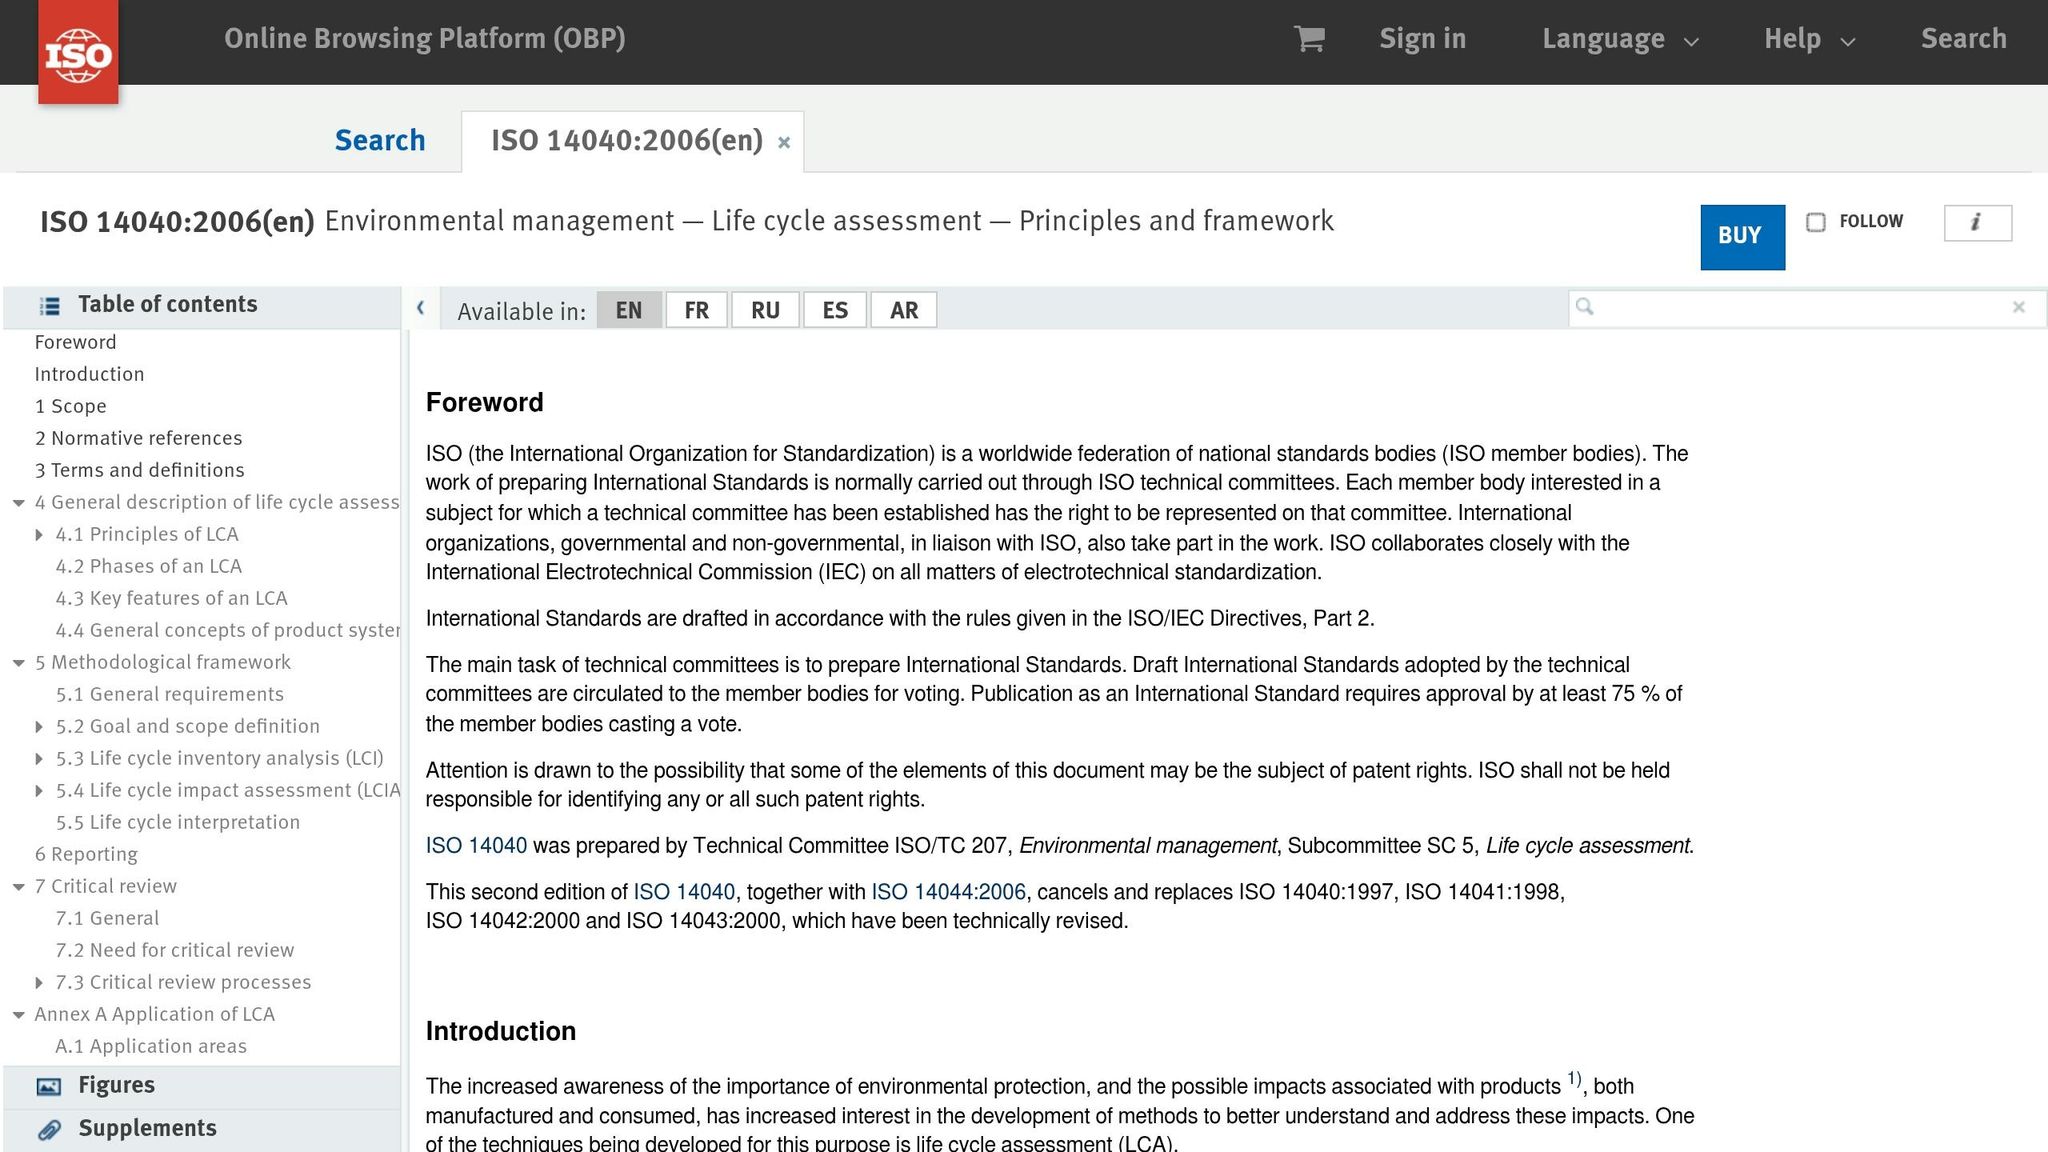
ISO 14067 rests on the life-cycle assessment framework set by ISO 14040 and ISO 14044. ISO 14040 lays out the main principles and structure for LCA. ISO 14044 gets more specific, covering requirements and guidance for goal and scope definition, inventory analysis, impact assessment, interpretation, reporting, and critical review.
For olive oil, that means defining the study, gathering life-cycle data, turning emissions into CO₂e, and checking the results for completeness and consistency.
One published olive oil study reported 17.53 kg CO₂e per liter, with distribution accounting for 55% of the total.
Frameworks Used Alongside ISO Standards
Some buyers ask for more than ISO alone. They may want product-specific rules or declaration-based frameworks. Here’s a side-by-side look at the three most common options.
| Framework | Scope | Typical Deliverable | Third-Party Verification Required? |
|---|---|---|---|
| PEFCR (Product Environmental Footprint Category Rules) | EU-level product-specific rules for olive oil that define the functional unit, system boundaries, impact categories, and modeling choices | Standardized LCA results that can be compared across producers | Typically, yes |
| ISO 14025 (Environmental Product Declarations) | Type III environmental declarations based on LCA and product category rules; may cover multiple impact categories beyond carbon | Published EPD document, often under a product category rule such as PCR 2010:07 for virgin olive oils | Yes, before publication |
| Olive Oil Sustainability Protocols | Broader voluntary frameworks covering farming practices, water use, biodiversity, and emissions reduction alongside carbon | Certification, audit report, or sustainability label | Varies by scheme |
Once the framework is in place, the footprint calculation can begin.
sbb-itb-4066b8e
How Olive Oil Carbon Footprints Are Calculated
Once the standard is in place, the math usually moves through three main steps.
Define the Functional Unit and System Boundaries
Using the ISO framework above, the process starts with two choices: the functional unit and the system boundary. Common functional units include 1 liter of packaged olive oil or a set bottle size like 500 mL or 750 mL. The right choice depends on the claim or declaration you plan to make.
System boundaries set the start and stop points for the calculation. Cradle-to-gate covers orchard inputs through cultivation, harvesting, transport to the mill, milling, and packaging up to the moment the product leaves the factory. Cradle-to-grave goes further. It adds distribution, retail, consumer use or storage, and end-of-life packaging disposal.
Many producers begin with cradle-to-gate because it’s easier to measure and works well for supplier reporting. But if the goal is a consumer-facing footprint claim, cradle-to-grave may be the better fit.
Once that scope is locked in, data collection gets much simpler.
Collect Emissions Data from Orchard to Delivery
After setting the boundary, gather activity data for every stage inside it. That includes orchard inputs, irrigation energy, field fuel, transport to the mill, milling energy, wastewater, packaging materials, and delivery distance.
One detail matters more than people expect: smaller bottles often carry a higher packaging footprint per liter. Why? Because the glass is spread across less oil.
From there, the job shifts from tracking inputs to turning them into emissions numbers.
Convert Activity Data into kg CO2e and Review Results
Each activity is multiplied by an emission factor tied to that input. That means using factors for diesel, electricity, fertilizer, transport, and glass. The final results are reported as carbon dioxide equivalent (CO2e), which puts CO2, methane, and nitrous oxide on one shared scale using IPCC global warming potential values.
Emission factors should come from a recognized database or a local grid factor. Electricity can vary a lot by location, so a mill in California may end up with a different footprint than one in another state because the grid mix is different.
The calculation also needs to split direct emissions from indirect emissions. Direct emissions come from fuel burned on site or in owned vehicles. Indirect emissions come from purchased electricity, fertilizer production, packaging manufacture, and outsourced transportation.
In olive oil, the biggest sources are often agriculture, glass packaging, and transport. A sensitivity check helps show which inputs move the final number the most.
The next step is to check the inventory, assumptions, and records against the chosen standard.
Verification, Certification, and Compliance Workflow
After the footprint is calculated, the next step is proving the result can hold up under review.
Prepare the Inventory, Assumptions, and Supporting Records
Gather dated utility bills, transport invoices, supplier declarations, packaging specs, production volumes, and waste records for one reporting period. Then document every assumption, including estimated distances and allocation choices.
Use a version-controlled file set so each number can be traced back to a source document. That paper trail matters. It becomes the base for internal review and external verification.
Internal Review and Third-Party Verification
Start with an internal review before bringing in an outside verifier. The sustainability or quality manager should cross-check activity data against financial records, rerun sample calculations, and confirm that the system boundaries match the methodology report.
This creates a clean line between an early internal estimate and a result that’s ready for outside scrutiny.
Third-party verification usually follows a familiar process. The verifier reviews the methodology report, inventory files, and calculation workbooks. They check whether the study matches both the methodology report and the source records. They may also ask for more evidence, such as bills of lading, meter readings, or supplier questionnaires. In some cases, they’ll interview staff or visit the site.
Expect a few rounds of revisions before the verifier issues a final statement. One wording point matters here: do not say "ISO 14067 certified"; say the product carbon footprint study or declaration was verified to ISO 14067.
What the Verified Output Looks Like
Once verification is done, the study can be issued as a report or declaration. The final output is a verified product carbon footprint (PCF) report that states the result in kg CO₂e per functional unit, along with the methods and data behind it.
It can also be published as an Environmental Product Declaration (EPD) under ISO 14025 through a program such as Environdec. In that format, the declaration shows upstream, core, and downstream impacts.
Examples make this more concrete. A Monini Extra Virgin Classic Oil EPD from February 2024 reports a life-cycle fossil global warming potential of about 1.186 kg CO₂e per functional unit. Of that total, upstream processes account for 0.7901 kg CO₂e, core production for 0.3226 kg CO₂e, and downstream for 0.0730 kg CO₂e.
Borges International Group reported a 35% reduction in the carbon footprint of its extra virgin olive oil. The main drivers were a switch to renewable electricity in packaging operations and the use of 80% recycled material in packaging.
A verified PCF or EPD gives you something concrete to use in website claims, procurement responses, and sustainability reporting.
Main Reduction Levers and Final Takeaways
Where Olive Oil Producers Usually Focus Emission Reductions
Once the footprint is verified, the next move is simple: go after the biggest sources first.
| Impact Area | Implementation Difficulty | Supply-Chain Stage |
|---|---|---|
| Orchard input management (precision fertilization, efficient irrigation, lower synthetic inputs) | Medium–High | Cultivation and harvesting |
| Mill energy efficiency (high-efficiency equipment, heat recovery, process optimization) | Medium | Milling and processing |
| Renewable electricity (rooftop solar PV, green tariffs, power purchase agreements) | Medium–High | Milling, storage, office |
| Lower-impact packaging (lightweight glass, higher recycled content, bulk formats) | Low–Medium | Packaging and bottling |
| Logistics optimization (consolidated shipments, sea freight instead of air, route planning) | Low–Medium | Distribution and transport |
| By-product valorization (pomace for bioenergy, composting, soil amendment) | Medium | Post-milling waste handling |
| Storage efficiency (better insulation, temperature control, nitrogen blanketing) | Low–Medium | Storage and warehousing |
Verified footprint work shows where cuts are easiest to measure. And some of these differences are not small. Process choice, for example, can shift the result a lot: two-phase extraction averaged 1.13 kg CO₂e per kg of oil, while three-phase systems averaged 2.27 kg CO₂e per kg.
Energy is another big lever. At mills, solar PV has shown carbon footprint cuts ranging from 22% to 119%, depending on self-consumption share and system boundaries. That range is wide, but the point is clear: energy setup can swing the final number in a big way.
For bottled EVOO, packaging and long-distance transport often drive the biggest downstream emissions. That’s why these hotspots usually become the backbone of the reduction plan.
How to Build a Carbon Reduction Plan
Start with the verified footprint, then rank hotspots by two things: impact and ease of action. After that, test the variables that shift the result most.
Sensitivity analysis helps here. It shows which inputs matter most, such as:
- bottle weight
- grid emissions
- transport mode
Then set targets that are specific and time-bound. A goal like cut packaging-related emissions per liter by 20% within five years is clear enough to track, report, and manage.
The plan also needs ownership. Write down the actions, assign responsibility, and fold the work into your current quality or environmental management system. Reassess the full footprint every one to three years to check progress and adjust course when needed. Third-party verification should also be repeated at each reassessment cycle.
Conclusion: The Standards, Steps, and Actions That Matter Most
ISO 14067 is the main product carbon footprint standard, backed by ISO 14040 and ISO 14044. Claims only hold up when they rest on primary data, transparent methods, and third-party verification.
The article follows a clear four-part path: standard, calculation, verification, and reduction. In practice, the biggest cuts often come from packaging, mill energy, logistics, and orchard inputs. That sequence - pick the right standard, calculate carefully, verify the result, and act on the hotspots - is what turns a carbon figure into a claim that can stand up to scrutiny and improve over time.
FAQs
What is a functional unit?
A functional unit is the clear, measurable basis used to compare impact in a Life Cycle Assessment (LCA).
Put simply, it sets what the emissions are for and how they’re measured. That way, carbon footprint results stay consistent across each stage of production, from cultivation and harvesting to processing, packaging, and transportation.
Do I need cradle-to-grave reporting?
Cradle-to-grave reporting is a standard Life Cycle Assessment approach that looks at every stage of olive oil production. That includes farming, processing, packaging, and waste management.
It isn't always required. Still, it plays an important role. It helps identify environmental hotspots, supports transparency, and helps verify sustainability claims and environmental goals.
How often should a footprint be updated?
Update your carbon footprint measurements for at least two years before and after you put lower-impact practices in place.
That longer time frame gives you data you can actually compare. It helps you track progress over time, spot where emissions shift, and aim your reduction efforts with more precision.