

New Studies on Olive Oil Carbon Footprint
Here’s the short answer: olive oil does not have one fixed carbon footprint. Recent studies show totals can shift a lot based on farming, packaging, shipping, and where the study starts and stops. Reported cradle-to-gate results often fall around 0.6 to 1.6 kg CO₂e per liter, but some bottle-level studies are much higher once packaging and delivery are added.
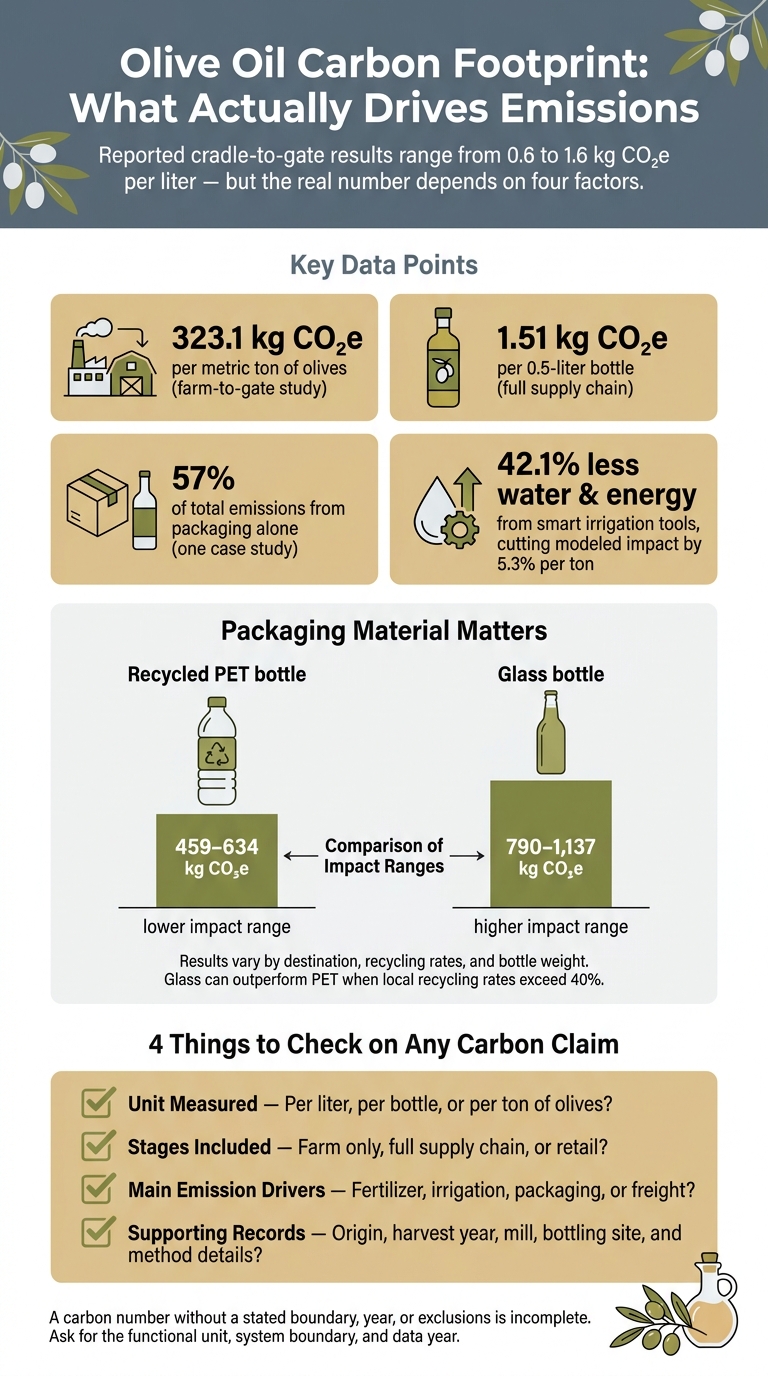
If I’m judging a carbon claim, I check four things first:
- What unit is being measured - per liter, per bottle, or per ton of olives
- What stages are included - farm only, up to bottling, retail, or disposal
- What drives most emissions - often fertilizer, irrigation, fuel, bottle material, and freight mode
- What records back the claim - origin, harvest year, mill, bottling site, package specs, and method details
A few numbers show why this matters:
- One study put oil from 1 metric ton of olives at 323.1 kg CO₂e
- Another put a 0.5-liter bottle at 1.51 kg CO₂e
- In one case, packaging made up 57% of the total
- An irrigation tool cut water and energy use by 42.1% and lowered modeled impacts by 5.3% per ton
So when I read these studies, the main takeaway is simple: don’t trust one headline number by itself. I look for the study boundary, the product unit, the year, and whether the brand shows records that match the claim.
| What I check | Why it matters |
|---|---|
| Farming inputs | Fertilizer, irrigation, fuel, and yield often drive a large share |
| Packaging | Glass, recycled PET, and container weight can shift totals a lot |
| Transport | Sea, truck, and air freight can lead to very different results |
| Carbon method | A number without scope, year, or exclusions tells me little |
| Source records | These can show origin and custody, but not footprint by themselves |
If I want lower-impact olive oil, I focus on where it was grown, how it was packed, how it moved, and whether the carbon claim explains its method in plain terms.
Olive Oil Carbon Footprint: Key Emission Drivers & What to Check
This or That Edition #14: Olive Oil vs Avocado Oil #carbonfootprint #cooking
sbb-itb-4066b8e
Study Summaries: Grove Management, Packaging, and Transport as Emission Sources
Here are the main findings across the three stages that most often shape olive oil’s footprint: grove management, packaging, and transport. These are the kinds of details a producer should be able to show, not just mention.
Grove Management Often Accounts for a Large Share of Emissions
Farm work is the most common emissions hotspot across olive oil LCAs. Fertilizer production and field use, pesticide use, irrigation pumping, and diesel-powered machines all add up. The effect shifts a lot based on climate, yield, and what the study includes.
One farm-to-gate study reported average annual impacts during the first 11 years of grove establishment at about 1.507 metric tons of CO₂-equivalent per hectare per year, with fertilizers and pesticides among the main drivers. Results can change based on climate, soil, electricity mix, fertilizer rates, and yield. Another study found that an irrigation decision tool cut water and energy use by 42.1%, which lowered total modeled impacts by 5.3% per ton of product and 10.4% per hectare compared with standard irrigation decisions. So if a producer makes a low-impact claim, it should point to clear steps such as drip irrigation, lower fertilizer use, cover crops, or renewable electricity - not a broad green promise.
Comparative farm-to-gate studies of southern Portuguese olive systems found that higher tree density increased impacts per hectare, with fertilization as the main source, though yield still changes impacts per liter. Measured climate-change impacts ranged from about 1.80–2.41 kg CO₂-equivalent for standard rainfed systems to 2.28–3.26 kg for intensive systems, depending on the modeled farm and the assumptions used. In plain English: don’t treat standard, intensive, or super-intensive as complete carbon labels. What matters is the measured result for a stated amount of oil, plus records on fertilizer, irrigation, fuel, and yield.
Some studies also report that olive trees and soils can absorb meaningful amounts of carbon. One southern Spain study found an average balance of 2.13 ± 2.18 metric tons of carbon per hectare per year, and another study found negative carbon footprints or net carbon gains in some standard irrigated and intensive systems when organic fertilizer and temporary cover crops were included. That’s a wide spread. If a producer says its oil is carbon negative, treat that as unproven unless it shares the measurement method, baseline, time frame, and land-use assumptions.
If farming sets the starting point, packaging can still push the total up or down.
Packaging Choices Can Change the Final Carbon Result
Packaging is often the next big contributor in a full supply-chain assessment. And the picture is more complicated than “glass bad, plastic good.”
A 2023 comparative LCA modeled extra-virgin olive oil in glass bottles versus 100% recycled PET plastic bottles across different destination countries. The recycled-PET system produced global-warming impacts of 459–634 kg CO₂-equivalent, compared with 790–1,137 kg CO₂-equivalent for the glass system. For several impact categories, recycled PET came in below 40% of the glass system’s impact. That’s a strong result, but the same study also showed that destination and transport assumptions can change the outcome.
A UNEP-linked assessment, on the other hand, found that glass could beat PET when local glass recycling rates were above 40%. So no material wins every time. The result depends on bottle weight, recycled content, where the oil is shipped, and what recycling systems are in place at the destination.
| Packaging factor | Why it matters | Evidence shoppers can check |
|---|---|---|
| Bottle or container weight | Heavier packaging needs more material and usually adds freight emissions. | Net package weight, container weight, and whether the producer reports lighter packaging. |
| Material type | Glass, recycled PET, tin, and multilayer systems carry different production and recycling burdens. | Exact material specification rather than a general eco-friendly label. |
| Recycled content | Recycled inputs can lower demand for virgin material, but the payoff depends on the material and supply chain. | Verified percentage of post-consumer recycled content. |
| Shipping distance and mode | Freight mode can matter more than distance by itself; air freight is usually the highest-emissions option. | Bottling location, freight mode, and whether shipments are consolidated. |
| Local recycling or reuse system | The modeled end-of-life benefit depends on real collection and processing rates in the destination market. | Clear disposal instructions and evidence tied to the shopper’s local recycling system. |
| Package size and format | Larger containers can lower packaging per liter, but only if the oil gets used before quality drops and the container fits household use. | Volume, container-to-oil ratio, closure design, and expected household use. |
Even a lighter package can lose its edge if it takes the wrong route.
Transport Can Be Minor or Major Depending on Distance and Freight Mode
Transport can look minor in farm-to-gate studies but much larger in cradle-to-grave studies that include bottling, storage, and distribution.
What drives transport emissions in practice is grove-to-mill distance, mill-to-bottling distance, bottling-to-distribution distance, shipment weight, transport mode, shipment consolidation, and storage before retail. Distance by itself doesn’t tell the whole story. The same 2023 packaging study found that ship transport was generally better than truck transport even over longer distances. Air freight, by contrast, can sharply increase transport-related emissions even on shorter routes.
For U.S. shoppers buying imported oil, it helps to ask where the olives were grown, milled, bottled, and shipped, and whether the freight moved by sea or truck instead of air. A producer that can answer all of that gives you a much clearer picture than one that only lists a country of origin.
These source details are what to check before judging carbon claims.
How to Read Carbon Claims and Source Records
Footprint results can change a lot depending on the stage measured and the method used. So the next step is simple: check what a claim actually proves.
When you're judging an olive oil claim, it helps to split it into four parts: traceability (documented product movement), transparency (shared records and methods), certification (third-party standard compliance), and carbon accounting (the emissions calculation). These ideas connect, but they are not the same thing. A fully traceable oil can still have a large footprint. A certification badge also doesn't automatically mean low emissions.
What a Credible Carbon or Sourcing Claim Should Include
A carbon claim needs a few basic details to mean much. It should name:
- the product
- the unit measured
- the geography
- the reporting period
- the life-cycle stages covered
- whether emissions and removals are shown separately
ISO 14067 requires emissions and removals to be documented separately before any net figure is presented. That matters. If a producer subtracts estimated grove carbon storage from operating emissions without showing how those removals were measured, it's hard to judge the net number with any confidence.
Carbon-neutral claims need even more than that. They should show measured emissions, supply-chain reductions, offset projects, double-counting safeguards, and any delayed reductions. If a label skips those details, you're not looking at a documented result. You're looking at an unsupported claim. From there, source records help show whether the product chain lines up with what the claim says.
What Provenance Details Can and Cannot Prove
Source records are useful for checking origin and handling. But they do not prove emissions performance.
Details like a harvest date, lot number, bottling record, and origin statement do real work. They help establish identity, timing, and custody. Big Horn Olive Oil provides harvest timing, lot records, and cold-press timing. That tells you something concrete about how and when the oil was processed, which matters for supply-chain accountability.
But those records don't tell you the carbon intensity of the fertilizer, how much energy irrigation used, how the packaging was made, or how the oil moved from the bottling facility to your door. Harvest dates and lot numbers can prove origin and custody. Product-level emissions data proves footprint. Those are two different jobs, and mixing them up is where people get misled.
Buying Guidance for U.S. Shoppers Who Want Lower-Impact Olive Oil
Use the study findings as a shopping filter: origin, packaging, and shipping details matter most.
What to Check Before You Buy
Start with the label. Check where the olives came from, how the oil was packed, and how it was shipped. Look for a named growing region or estate, a named mill, and a clear harvest or production year. “Bottled in Italy” does not mean the olives were grown or milled there. That kind of detail helps with traceability in a way that a vague “imported” or “packed in” statement simply doesn’t.
Then look at the package itself. Compare the material, bottle weight, and any verified recycled content. A stated recycled-content percentage tells you a lot more than a recycling symbol on its own. Shipping method matters too - sometimes as much as the package. If you can, check whether the oil moved by sea, truck, or air. Over the same distance, sea freight usually has lower emissions than truck or air.
Size matters as well. If you use olive oil often, a larger tin can mean less packaging per ounce. If you only use it now and then, a smaller bottle may help you avoid waste.
A Simple Evidence Ranking for Purchase Decisions
Not all claims mean the same thing. Some give you solid proof. Others are mostly sales language. Here’s a simple way to sort the evidence:
| Evidence Type | What It Tells You |
|---|---|
| Product-specific LCA or verified footprint with a clear life-cycle boundary, functional unit, and reporting year | The fullest picture; shows which stages were measured and how |
| Farm, mill, packaging, and logistics records backed by independent certification or audit | Strong traceability; confirms what was checked and when |
| General marketing claims without quantified scope | Helpful context, but not a documented result |
| A carbon number without boundary, year, or exclusions | Incomplete; the missing parts may account for a large share of actual impact |
When you shop online, go past the product listing and check the producer’s sourcing and sustainability pages. In a store, a lot code or QR code may lead you to more detail. If a claim matters to you, it’s reasonable to contact customer service and ask for the functional unit, system boundary, and data year. A producer that answers those questions is giving you better evidence than one that only points to a certification badge or a freshness story.
For Big Horn Olive Oil, check whether the product page lists the olive-growing region, mill, bottling location, harvest year, package weight, and shipping mode. Judge the claim based on those records - not the label design.
Conclusion: What the Latest Research Means for Better Olive Oil Choices
The research lands on the same plain-English takeaway: pay attention to the main emission hotspots, not just one carbon number. Recent life-cycle studies show there isn't one carbon figure that fits every bottle of olive oil. Results change based on grove management, packaging, transport, and the study boundaries used.
The main pressure points show up again and again. Agricultural inputs like fertilizer, fuel, irrigation, and harvesting equipment often make up a large share of emissions. Packaging can swing the final result in a big way. Transport also varies by shipping method, load size, and package weight more than distance alone. In most cases, sea and ground freight produce less emissions than air freight.
That’s why source records matter only when they tie back to a clear carbon claim. Provenance records can confirm where the oil came from and how it was handled. They do not prove a lower footprint by themselves. What helps is a label that spells out the origin, mill, bottling site, harvest year, and the scope of the claim. That gives you something concrete to check. Broad sustainability language, on its own, doesn’t.
Before you buy, use this quick checklist:
- Origin, milling, and bottling locations disclosed - Are the growing region, mill, and bottling site clearly named, instead of hinted at?
- Harvest year shown - Is there a harvest date or year, not just a best-by date?
- Packaging material and weight clear - Does the brand list the container material, size, and approximate weight?
- Carbon-claim boundary explained - Does the claim say what it covers: farming only, the full supply chain, transport, packaging, carbon storage, and offsets?
For Big Horn Olive Oil products, the same checklist applies. Look for the olive-growing region, harvest year, milling and bottling details, packaging specs, and any carbon method used. Those records - not broad sustainability claims alone - give you a sound basis for comparison.
FAQs
Why do olive oil carbon footprints vary so much?
Olive oil carbon footprints vary because they depend on the full lifecycle. In most cases, the biggest share comes from farming (76.3%). That usually means fuel for machinery, fertilizer use, and whether the olives are grown in intensive systems or rainfed groves.
Processing energy, packaging, and shipping also shape the total footprint. Heavy glass bottles add more emissions during both packaging and transport. And if oil is shipped by air, the impact jumps far above sea or road transport.
Grove management plays a part too. The way a grove is managed affects how much carbon the trees and soil hold onto versus how much they release.
Is glass or PET better for olive oil emissions?
Yes. PET usually leads to lower carbon emissions than glass because it weighs far less. A standard 1-liter PET bottle weighs about 36 grams, while a standard 1-liter glass bottle weighs about 460 grams. That big gap matters. Lighter packaging takes less energy to move, which cuts transport-related emissions.
Glass has some upsides. It’s recyclable and inert. But in many cases, its weight and production lead to a larger carbon footprint.
If you want a lower-impact option, look for 100% recycled PET (R-PET) or bag-in-box packaging.
What should I check before trusting a carbon claim?
Look for third-party certifications like USDA Organic, EU Organic, or Fair Trade. Also check for clear reporting backed by carbon footprint data or PDO status.
The most reliable claims usually come with data tracked for at least two years. It also helps to visit the brand’s website and look for details about farming practices, renewable energy use, and eco-friendly packaging.