

Olive Oil Standards: Fatty Acids and Purity Tests
One lab result cannot prove extra virgin olive oil. If you want to judge an olive oil label, I have to look at the whole test panel - fatty acids, free acidity, peroxide value, UV tests, sterols, waxes, alkyl esters, triacylglycerols, and sensory review.
Here’s the short version:
- Fatty acids check whether the oil’s profile fits olive oil.
- Free acidity shows hydrolytic breakdown and must be 0.8 g/100 g or less for U.S. extra virgin.
- Peroxide value shows early oxidation and must be 20 mEq O₂/kg or less under the USDA extra virgin spec.
- UV absorbance can show oxidation or refining signals that peroxide value may miss.
- Sterols, waxes, alkyl esters, and ECN 42 help flag blending, pomace influence, or processing issues.
- Sensory review still matters. An oil can pass chemistry and still fail for defects.
In other words: a fatty-acid profile is a screen, not a final answer. For example, oleic acid often falls around 55.0% to 85.0% under IOC-type limits, while linolenic acid should stay at 1.0% or less. But even if those numbers fit, the oil can still be oxidized, poorly handled, or mislabeled by grade.
If I were reading a lab report, I’d ask four plain questions first:
- Does it look like olive oil?
- Is it pure, or was something mixed in?
- Has it oxidized or broken down?
- Does it meet every rule for the grade on the label?
Quick comparison
| Test area | What it checks | What it cannot do alone |
|---|---|---|
| Fatty acids | Identity and profile fit | Prove grade or adulteration by itself |
| Free acidity | Hydrolytic breakdown | Show flavor, origin, or oxidation |
| Peroxide value | Early oxidation | Show the whole oxidation history |
| UV absorbance | Oxidation and refining clues | Replace the rest of the panel |
| Sterols / waxes / alkyl esters / TAGs | Purity, pomace influence, blending, processing history | Stand in for sensory review |
| Sensory panel | Defects and fruitiness | Replace chemistry |
So the main takeaway is simple: olive oil standards are built to read patterns, not single numbers. That’s the frame I’d use for the rest of this article.
sbb-itb-4066b8e
Fatty Acid Composition by Gas Chromatography
In this test, labs convert fatty acids into methyl esters, or FAMEs, then separate them with gas chromatography. The end result is a profile reported as % m/m of methyl esters. On its own, that profile doesn't say much. It becomes useful when you compare it with the accepted ranges in the governing standard.
Just as important: these numbers are analytical composition data, not the fat totals you see on a Nutrition Facts label.
Natural variation can shift results while still keeping them within the allowed range. Cultivar, origin, climate, crop year, fruit maturity, processing, and blending all play a part. One olive oil study from southeastern Brazil showed oleic acid ranging from 65.72% to 82.78% and linoleic acid from 4.48% to 12.48% - and both still fit Codex-type reference ranges. That's a good reminder that a number near the edge isn't, by itself, proof that something is wrong.
The Main Fatty Acids Labs Compare Against Standards
The table below shows the main fatty acids labs review during standards-based assessment.
| Fatty Acid | Approx. IOC Range (% m/m) | Main Analytical Purpose | What a Deviation May Suggest |
|---|---|---|---|
| Myristic (C14:0) | <0.03% | Screens for unusually high short-chain saturated fatty acids | Possible non-olive-oil fat contribution or atypical composition; investigate rather than declare adulteration |
| Palmitic (C16:0) | 7.00–20.00% | Measures a principal saturated fatty acid | An unusually high or low result may reflect cultivar, origin, blending, or another fat source |
| Palmitoleic (C16:1) | 0.30–3.50% | Supports species and profile consistency | An outlying value can support an identity concern when combined with other anomalies |
| Heptadecanoic (C17:0) | <0.40% | Minor-marker purity check | Elevated content can justify confirmatory testing |
| Heptadecenoic (C17:1) | <0.60% | Minor-marker identity check | An elevated result may be inconsistent with the expected olive-oil profile |
| Stearic (C18:0) | 0.50–5.00% | Measures a principal saturated fatty acid | An atypical result may indicate unusual raw material or blending |
| Oleic (C18:1) | 55.00–85.00% | Defines the dominant fatty-acid feature of olive oil | A low result or unusual combination with linoleic acid can prompt identity testing |
| Linoleic (C18:2) | 2.50–21.00% | Distinguishes normal variation from atypical polyunsaturated-fat levels | An unusually high or low result may suggest cultivar effects, origin effects, or blending |
| Linolenic (C18:3) | ≤1.00% | Checks a minor polyunsaturated fatty acid | An elevated result can indicate a need to investigate other vegetable oils or unusual composition |
| Arachidic (C20:0) | <0.60% | Minor saturated-fatty-acid purity marker | Elevated content may suggest another oil or nonstandard composition |
| Gadoleic (C20:1) | <0.50% | Minor unsaturated-fatty-acid check | Atypical levels require corroboration with other tests |
Codex references use slightly different limits for some items. For example, oleic acid may appear as 55.0–83.0%, while linoleic acid may appear as 3.5–21.0%. That means the very same lab result might pass under one framework and trigger review under another. So the report has to name the exact standard and revision used.
When a result falls outside those ranges, analysts don't treat that as the final word. They treat it as a signal to take a closer look.
How Fatty Acid Results Support Identity and Trigger Further Checks
Fatty-acid composition works mainly as an identity and consistency screen, not a verdict. If a profile lands outside a hard limit, the sample may fail a compositional standard. But that still doesn't tell you what was added, whether anyone meant to mislead, or whether the oil is not extra virgin.
It helps to separate three ideas that often get blurred together. A typical range is what you often see in a defined group of samples, and it's often narrower than the legal limit. A hard limit is the formal cutoff in the applicable standard; going past it can mean nonconformity, subject to measurement uncertainty. An investigative flag is just that - something unusual that calls for follow-up, not proof on its own.
Here's a plain example. Say a sample shows 53% oleic acid, 24% linoleic acid, and an elevated linolenic-acid result. Against the IOC ranges listed above, that pattern is concerning because oleic is below the lower reference point and linoleic is above the upper one. The next step isn't to jump straight to a fraud claim. The right move is to confirm the analysis, review the sample and the method, check cultivar and origin details, and run other identity tests.
If the repeat result still looks off, and other markers also point away from olive oil, the case gets stronger. But a fatty-acid profile by itself cannot prove adulteration. It's the opening signal in a broader purity review, not the whole story.
Free Acidity and Peroxide Value: The Basic Quality Pair
After identity screening, free acidity and peroxide value help show how well the oil has held up over time. These tests measure deterioration, not identity. More specifically, they track hydrolysis and oxidation.
What Each Test Measures and What High Values Can Mean
Free acidity measures hydrolytic breakdown. In plain English, triglycerides split and release free fatty acids. The result is reported as grams of free fatty acids, calculated as oleic acid, per 100 grams of oil. This is not pH, and it does not tell you how the oil tastes. The USDA sets a maximum of 0.8 g/100 g for U.S. Extra Virgin Olive Oil.
If a sample comes back above that limit, say 1.1 g/100 g, it does not tell you the exact cause by itself. It does, however, mean the oil misses the extra virgin cutoff. High free acidity often points to damaged or overripe fruit, delayed milling, moisture, or poor handling.
Peroxide value (PV) measures primary oxidation products, mainly hydroperoxides formed when unsaturated fats react with oxygen. Results are reported as milliequivalents of active oxygen per kilogram of oil (mEq O₂/kg). The USDA sets a maximum PV of 20 mEq O₂/kg for extra virgin olive oil.
A high PV points to oxidation linked to air, light, heat, or poor storage. But PV is only a snapshot. A lower number doesn't rule out oxidation that may show up later.
How to Read These Two Numbers Together
The key is to read these two numbers side by side.
| Test | What It Measures | What an Elevated Result May Indicate | Main Limitation |
|---|---|---|---|
| Free acidity | Free fatty acids from hydrolytic breakdown; reported as g/100 g as oleic acid | Damaged fruit, delayed milling, moisture, or poor handling | Does not measure oxidation, flavor, or authenticity |
| Peroxide value | Primary oxidation products, mainly lipid hydroperoxides; reported as mEq O₂/kg | Oxidation from air, light, heat, or poor storage | Snapshot only; later oxidation may continue after peroxides decline |
Low free acidity plus a moderate PV usually suggests limited deterioration. High acidity points to hydrolysis. High PV points to oxidation. And when this pair looks off, tests like sterols, waxes, and alkyl esters can help sort out whether you're looking at a quality problem, an identity problem, or adulteration.
Supporting Purity Markers and How a Full Product Review Uses Them
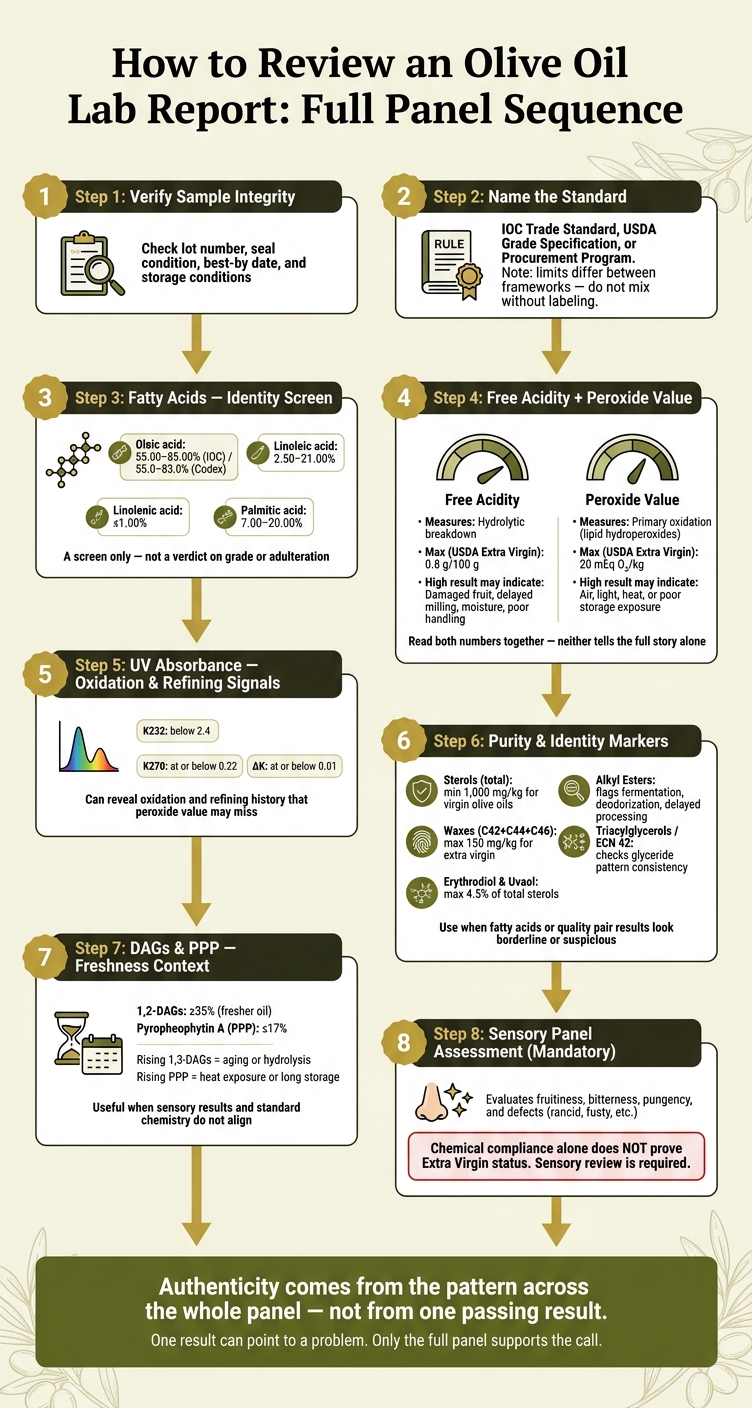
Olive Oil Extra Virgin Testing: Full Panel Review Sequence
After fatty acids and the basic quality checks, a full review turns to the markers that help separate actual olive oil from blending, pomace influence, or odd processing.
Sterols, Waxes, Alkyl Esters, Triacylglycerols, UV Absorbance, and Related Markers
If fatty acids and free acidity look fine, the next job is to see whether the oil’s deeper purity markers still match olive oil. Fatty acids don’t always settle the issue on their own. That’s where this next layer of testing comes in. And the key point is simple: these markers work best when you read them together, not in isolation.
Sterols act like a botanical fingerprint. The IOC sets a minimum total sterol content of 1,000 mg/kg for virgin olive oils. Individual sterols, especially campesterol, stigmasterol, and Δ7-stigmastenol, are checked against category-specific limits to spot profiles that don’t fit olive oil or that hint at blending with another vegetable oil.
Waxes help tell olive oil apart from pomace oil. The IOC caps C42 + C44 + C46 waxes at 150 mg/kg for extra virgin and virgin olive oils. Erythrodiol and uvaol, measured as a percentage of total sterols, help with that same distinction. The IOC limit for edible virgin olive oils is no more than 4.5%, with standard-specific notes and exceptions.
Alkyl esters can point to poor fruit quality or deodorized oil. Fatty acid ethyl esters, in particular, can signal fermented fruit, delayed processing, or oil that may have been deodorized to hide defects. Triacylglycerols and ECN 42 check whether the oil’s overall glyceride pattern is consistent with olive oil. That matters when a fatty-acid profile looks borderline normal, or when someone has used an adulterant chosen to imitate olive oil’s main fatty acids.
| Test Family | Primary Purpose | Classification Area |
|---|---|---|
| Sterols (total and individual) | Botanical identity; flags adulteration or atypical profiles | Identity and purity |
| Erythrodiol and uvaol | Distinguishes olive oil from pomace oil | Identity and purity |
| Waxes | Identifies composition anomalies; pomace or contamination signals | Purity and processing history |
| Alkyl esters | Indicates poor fruit quality, fermentation, delayed processing, or deodorized material | Purity and processing history |
| Triacylglycerols / ECN 42 | Tests whether the glyceride profile is coherent with olive oil; can reveal seed-oil or other-oil admixture | Identity and purity |
| UV absorbance (K232, K270, ΔK) | Assesses oxidation and possible refining or abnormal processing | Oxidation and processing history |
| Diacylglycerols and minor compounds | Freshness, hydrolysis, storage, and degradation clues | Freshness and degradation |
UV indices add another angle because they can show oxidation and refining signals that peroxide value may miss. They should be read alongside free acidity and peroxide value, not on their own. K232, K270, and ΔK can reveal oxidation and possible refining history that peroxide value may not catch. The USDA extra virgin specification sets K232 below 2.4, K270 at or below 0.22, and ΔK at or below 0.01.
Diacylglycerols (DAGs) and pyropheophytin A (PPP) add context on freshness and processing. A USDA commodity specification lists PPP at no more than 17% and 1,2-DAGs at or above 35% for the specified program. Higher 1,2-DAGs usually suggest fresher oil. Rising 1,3-DAGs point to aging or hydrolysis. PPP tends to go up with heat exposure or long storage, which makes it useful when sensory results and standard chemistry don’t quite match.
A Practical Review Sequence for Extra Virgin Olive Oil
Once you look at the whole marker set together, the testing order matters.
Start with sample integrity. Check the lot number, seal condition, best-by information, and storage conditions. After that, identify the applicable standard. That could be an IOC trade standard, a USDA grade specification, or a procurement program. The limits can differ, so they should not be mixed unless that’s labeled clearly.
Then move through the data in layers. Fatty acids screen identity first. Free acidity, peroxide value, and UV indices look at hydrolysis and oxidation as a group. If something seems off, move up to sterols, waxes, erythrodiol and uvaol, alkyl esters, and triacylglycerols. Use DAGs and PPP when storage or processing history is part of the question.
The last step is official sensory panel assessment, and there’s no way around it. Chemical compliance does not prove extra virgin status. An official sensory panel still has to confirm it. A rancid or fusty character may not show up fully in routine chemistry, especially after poor post-production storage.
That same sequence works for any bottled olive oil: verify identity first, then quality, then purity, and finish with sensory review.
Conclusion: Why Olive Oil Standards Require a Full Test Panel, Not One Number
No single number can prove category compliance. The IOC standard looks at fatty acids, free acidity, peroxide value, sterols, waxes, alkyl esters, triacylglycerols, UV absorbance, and sensory findings as one panel. That’s because one good result doesn’t cancel out a bad one. You can see solid fatty acids and still have high oxidation. You can see low acidity and still find sterol patterns that don’t fit olive oil. Either case can weaken a label claim.
That’s where fatty acids fit in. They’re the first identity screen, not the final call.
Free acidity and peroxide value add the main quality layer. Together, they show hydrolytic breakdown and primary oxidation at the time of testing. But on their own, they don’t prove origin or freshness. A low acidity result doesn’t settle the question. Neither does peroxide value by itself. The full panel fills in what those two numbers miss.
The numbers also depend on one thing: the standard being used. A lab result only has meaning inside the right standard. If the report doesn’t name the standard, method, units, and limits, the result sits there without much context.
In plain English, authenticity comes from the pattern across the whole panel, not from one passing result.
The best review is simple and complete. It names the standard, method, and units, then reports the full panel. One result can point to a problem. Only the full panel can support the call.
FAQs
Can an olive oil pass fatty-acid tests and still fail as extra virgin?
Yes. An olive oil can match fatty-acid profile expectations and still miss the extra virgin grade.
That’s because fatty acids are only part of the test. The oil also has to stay within other limits:
- FFA ≤0.8%
- Peroxide value ≤20 mEq O₂/kg
- UV absorbency (K270 ≤0.22)
And just as important, it must have no sensory defects.
Why do olive oil results vary under different standards?
Olive oil test results can vary because different groups use their own chemical standards to judge quality and purity. The IOC sets the global baseline, while regional groups like the COOC sometimes use tighter rules.
For example, the COOC limits free fatty acids to 0.5% or less. The IOC allows up to 0.8%. That gap shows the different aims behind each program and how strict each one chooses to be.
Which tests best detect adulteration or pomace influence?
Labs mainly use gas chromatography to check fatty acid profiles and sterol composition. With GC-FID and GC-MS, they can spot markers and ratios tied to olive-pomace oil influence and other non-authentic oils.
UV tests like K270 and Delta-K also help flag refined oils or adulteration. ECN 42 triglyceride content can add another layer of proof by showing contamination from seed or refined oils.