

Organic Olive Farming: Is It Financially Viable?
Yes - but only for growers who can survive the slow start, control costs, and sell at the right price.
If I had to sum it up in one line, it would be this: organic olive farming can pay off, but the wait is long and the margin for error is small. Startup costs can run from $8,000 to $15,000 per acre for orchard setup alone, plus land at $10,000 to $20,000 per acre in places like California. Many groves do not hit full break-even until year 8 to year 10, and some take longer.
Here’s the plain-English version:
- The first few years are cash-out years. Trees take time to produce, and the organic transition lasts about 3 years.
- Organic does not always mean much higher prices. In some periods, the premium has been above 10%. More recently, it has narrowed to near 0% in some market data.
- Yield makes a huge difference. Strong groves may reach about 210 gallons of oil per acre, while weaker sites may produce far less.
- Water, labor, and harvest method drive costs. Irrigation, pruning, weed control, and harvest can make or break profit.
- The best returns usually come from premium sales channels. Bulk oil is harder to make work. Bottled, single-origin organic EVOO sold direct or through specialty stores has more room for profit.
- Risk is high. Drought, heat, pests, alternate bearing, and labor costs can push break-even out by years.
If you’re looking at this as an investment, I’d watch four numbers first: profit per acre, cash flow timing, payback period, and IRR/NPV. Those tell you far more than headline price premiums.
| Factor | What the article shows |
|---|---|
| Startup cost pressure | High |
| Early-year cash flow | Negative |
| Organic price premium | Unstable |
| Best fit | Growers with good water, strong quality control, and premium buyers |
| Likely break-even | About 8–10 years |
| Main risk | Low yields or weak selling prices |
So the short answer is simple: organic olive farming is financially viable for some U.S. growers, but not by default. If I can’t produce steady yields, protect oil quality, and reach buyers willing to pay more than bulk rates, the numbers get tight fast.
Olive Tree Farming for Profit
What It Costs to Start and Run an Organic Olive Grove
Organic olive groves take a lot of money upfront before the first real harvest shows up. The costs fall into two groups: startup costs that land before the grove produces, and annual costs that keep showing up year after year. And, of course, those numbers only make sense if later revenue can pay them back.
Startup Costs: Land, Trees, Irrigation, Equipment, and Certification
Land is usually the biggest expense. In California, irrigated farmland that works for olives often costs $10,000–$20,000 per acre.
Then comes orchard setup. Over the first 3–4 years, orchard establishment often runs $8,000–$15,000 per acre. That covers trees, irrigation, and early-stage grove care. Tree purchase and planting by themselves usually add $2,500–$4,500 per acre at standard densities of 120–150 trees per acre.
Irrigation can also take a big bite out of the budget, especially in dry areas like California, Arizona, and parts of Texas. A full drip system with filtration, pumps, and emitters can add $3,000–$8,000 per acre.
Equipment costs change a lot based on size. Smaller growers often hire harvest contractors instead of buying expensive machines. That keeps startup spending lower. Mechanical harvest can cut harvest costs on larger farms, but it comes with a big upfront price tag.
Organic certification adds another layer. Initial fees often land around $750–$1,500 for many small farms. The USDA Organic Certification Cost Share Program can reimburse up to 75% of those fees, with a cap of $750 per scope per year.
Once the grove is in the ground, the hard part shifts from setup to yearly spending and whether production can keep up.
Annual Operating Costs and the 2–3 Year Transition Period
After planting, the grove starts carrying annual costs. Labor is often one of the biggest. Organic systems usually lean more on mechanical cultivation, scouting, and hand work, so jobs like pruning, weed control, and harvest can add up fast.
Other yearly costs include compost and approved organic inputs, irrigation water and power, fuel, insurance, property taxes or lease payments, and certification renewal fees. Even the routine orchard work alone can stack up pretty fast.
| Practice | Estimated Annual Cost per Acre |
|---|---|
| Weed control | $200–$400 |
| Organic fertilization | $150–$300 |
| Pruning | $300–$500 |
| Pest/disease monitoring | $200–$400 |
These numbers do not include harvest, water, fuel, maintenance, or insurance, so total annual costs will be higher.
The 2–3 year transition period is where many growers feel the squeeze. During that stretch, they take on organic production costs without getting organic prices. In plain English: the money goes out before the premium comes in. A sound financial plan should expect several years of negative or near-zero operating margin before the grove gets to break-even.
Cost Summary Table: Startup vs. Annual Expenses
| Cost Category | Type | Organic Cost Pressure |
|---|---|---|
| Land acquisition or lease | Startup | High, especially in California |
| Site prep and soil testing | Startup | Moderate |
| Tree purchase and planting | Startup | Moderate ($2,500–$4,500/acre) |
| Drip irrigation system | Startup | High ($3,000–$8,000/acre) |
| Equipment (tractors, harvesters) | Startup / Ongoing | Moderate to high |
| Initial organic certification and setup | Startup | Low to moderate |
| Pruning labor | Annual | High |
| Weed control | Annual | High |
| Compost and organic inputs | Annual | Moderate to high |
| Pest and disease monitoring | Annual | Moderate |
| Certification renewal | Annual | Moderate ($400–$2,000+ per year) |
| Insurance and property taxes | Annual | Moderate |
The next question is whether yields and selling prices can cover these costs.
How Organic Olive Farms Generate Revenue
Organic olive farms make money by selling oil. That means revenue comes down to oil output and price per gallon, not just how many olives a farm harvests.
Yield Expectations in Organic Groves
Because farms sell oil, cash flow depends on two things: yield and price per gallon. In super-high-density systems, many U.S. growers expect little to no commercial crop in years 1–2, then lighter production in years 3–4. One University of California, Davis cost study estimated mature super-high-density orchards in the Sacramento Valley at about 5.0 tons of olives per acre, yielding around 210 gallons of olive oil per acre. In that model, the orchard starts producing an economic crop in year 3 and reaches peak yield by year 5.
Not every site hits those numbers. Lower-input groves or weaker sites may top out at just 1–2 tons per acre at maturity. That’s a big gap, and it changes the income picture fast.
One of the biggest wildcards is alternate bearing. Olive trees tend to swing between heavy “on” years and lighter “off” years. So a farm can look great one season and much weaker the next. That back-and-forth affects oil volume and cash flow in a very direct way. For planning, multi-year yield averages matter much more than one big harvest.
Water also has a direct effect on revenue. Steady irrigation usually helps fruit set, smooths out production, and supports more steady revenue per acre. Harvest timing matters too. An earlier harvest can mean less volume but better quality. A later harvest can lift oil content, but it may weaken appeal in premium markets. In plain English: the big question is how much oil the grove can make once it’s fully mature.
Price Premiums, Quality, and U.S. Market Demand
Once the orchard starts producing, revenue depends a lot on where the oil gets sold. Farms that reach premium channels usually get paid for freshness, traceability, and sensory quality, not just volume.
The U.S. organic olive oil market has been growing faster than the broader olive oil market. Data cited by Olive Oil Times shows that organic olive oil sales volume rose 7.2% in the 52 weeks ending April 24, 2024, while total extra virgin olive oil sales volume fell 2% during that same period. That spread points to stronger U.S. demand for certified organic oil.
But certification by itself doesn’t lock in a premium. USDA ERS data shows that the organic price premium for extra virgin olive oil in smaller containers was above 10% for much of 2013/14–2018/19, then tightened to near 0% by marketing year 2023/24 as global supply got tighter and prices moved up. So if a grower is counting on the organic label alone to justify a higher price, that’s a gamble.
What tends to move price most is quality. Specialty retail buyers and direct-to-consumer customers will often pay more for oils with low free fatty acidity, strong sensory scores, and clear traceability. That usually comes from tight harvest-to-mill timing, careful fruit handling, and modern milling equipment. When a brand can show freshness, origin, and strong sensory quality, it has a better shot at stronger pricing.
Certified quality can also help on the shelf. The North American Olive Oil Association (NAOOA) reported that in 2025, 49% of branded olive oils sold in the U.S. carried the NAOOA Certified seal. Big retailers such as Whole Foods Market, Sprouts, and Kirkland also stocked certified products. That matters because certification and verified quality can help a producer get into better retail spots. So no, yield alone doesn’t decide revenue. Price depends on what buyers think the oil is worth.
Revenue Comparison Table: Bulk, Organic, and Premium Channels
| Sales Channel | Yield Potential | Pricing Strength | Customer Access | Margin Opportunity |
|---|---|---|---|---|
| Bulk conventional | Can absorb large volumes | Lowest | Broad industrial buyers and packers | Low |
| Bulk organic | Similar orchard output, with certification opening more outlets | Moderate | Specialized wholesalers and processors | Moderate |
| Premium organic EVOO | Lower channel capacity; quality-driven | Highest | Specialty retail and direct-to-consumer buyers | Highest |
Most growers don’t rely on just one outlet. A mix often makes more sense: send part of the crop to bulk organic buyers for steady baseline cash flow, then push the best lots into branded retail or direct-to-consumer bottles, where margins are much stronger.
The UC Davis study priced oil output at $13 to $19 per gallon in one Sacramento Valley case. Premium channels can pay several times bulk prices, but they also come with higher packaging, marketing, and distribution costs. That tradeoff leads straight to the next issue: when does the farm finally turn cash-flow positive?
sbb-itb-4066b8e
When Does an Organic Olive Grove Become Profitable?
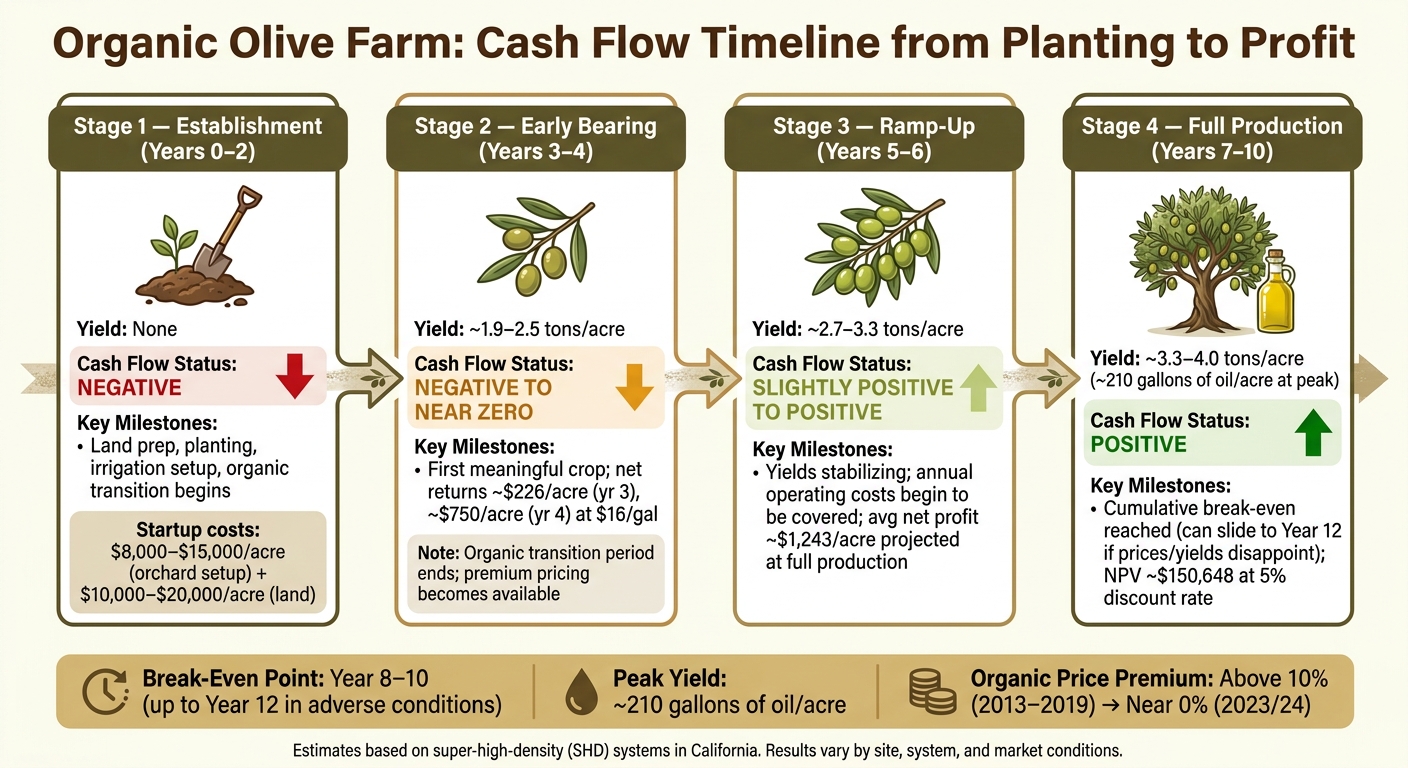
Organic Olive Farm: Cash Flow Timeline from Planting to Profit
Organic olive farming usually takes time to pay off. You spend money up front on land prep, trees, irrigation, and organic transition long before the grove brings in much income. So the main issue isn't whether revenue can come in. It's how long it takes to earn back what you put in.
Cash Flow Timeline from Planting to Full Production
In years 0–2, the grove is still getting established. This is when planting, irrigation setup, and transition costs hit, but there isn't much revenue to soften the blow.
Things often start to change in year 3. Research on super-high-density (SHD) systems in California found that trees can begin economic production around then. One UC-linked study estimated net returns of about $226 per acre in year 3 and roughly $750 per acre in year 4, assuming a grower payment of $16 per gallon of oil. Put simply, the production system you choose has a big effect on how fast income starts covering costs.
By years 4–5, a well-run SHD grove may be close to full production or already there. Traditional or low-density groves move at a slower pace. In many cases, they need 7–10 years before yields become commercially meaningful.
Annual operating cash flow may edge into positive territory around years 4–6, depending on debt load, labor costs, and the type of farming system in use. But turning positive on annual operations is not the same as full break-even. Recovering the entire upfront investment usually takes longer. In the U.S., many well-managed organic olive projects reach true break-even - when total income finally covers all startup and operating costs - around years 8–10. If financing terms, prices, or yields move the wrong way, that point can slide out to year 12.
Key Metrics: Gross Margin, Net Profit, NPV, and IRR
That slow ramp-up matters because it shapes the return on the whole project. Four metrics do most of the heavy lifting here:
- Gross margin: what remains from oil sales after direct production costs are paid.
- Net profit margin: what remains after all costs, including overhead, depreciation, interest, and the owner's time.
- Payback period: how many years of cash flow it takes to recover the upfront investment.
- Net present value (NPV) and internal rate of return (IRR): measures that translate future cash flow into today's dollars so you can judge whether the wait pays off.
A Kansas State feasibility model projected full production in year 5, average net profit of $1,243 per acre, and an NPV of $150,648 at a 5% discount rate. That's a solid reference point for what a well-planned operation can show on paper.
Timeline Table: Yield Growth, Costs, and Break-Even Stages
| Stage | Years | Typical Yield | Cash Flow Status | Key Milestones |
|---|---|---|---|---|
| Establishment | 0–2 | None | Negative | Land prep, planting, irrigation, organic transition begins |
| Early bearing | 3–4 | ~1.9–2.5 tons/acre | Negative to near zero | First meaningful crop; revenue may begin to offset some operating costs |
| Ramp-up | 5–6 | ~2.7–3.3 tons/acre | Slightly positive to positive | Yields stabilizing; annual operating costs begin to be covered |
| Full production | 7–10 | ~3.3–4.0 tons/acre | Positive | Cumulative break-even approaches; full profit potential |
Main Risks, Profit Drivers, and Final Takeaway
Production and Market Risks That Can Hurt Returns
Those break-even gains only hold if weather, pests, and pricing stay fairly steady. In practice, that’s where things get messy.
Drought, heat, pests, and labor costs can wipe out what looked like a profitable year. Long dry spells push irrigation costs up and cut yields. Heat waves during flowering can trigger fruit drop, which leads to big year-to-year swings in output. For organic growers, olive fruit fly is a major headache. There are fewer approved treatment options, so a poorly managed infestation can damage fruit and drag down oil quality.
Labor is another pressure point. Pruning, scouting, and harvest all cost money, and higher farm wages squeeze margins even more. Then there’s the sales side. If a farm doesn’t have strong sales channels, the organic price premium can disappear fast. Bulk sellers face the most price volatility, while premium channels do more to protect margins.
Any one of these issues can push break-even farther out.
Risk and Return Table: Major Risks and Ways to Improve Outcomes
| Major Risk | Likely Impact on Profitability | Practical Steps to Reduce It |
|---|---|---|
| Drought and water scarcity | Higher irrigation costs, lower yields, reduced oil quality | Drip irrigation, moisture monitoring, secure water rights, targeted deficit irrigation |
| Heat waves and yield swings | Flower/fruit damage, less predictable cash flow | Heat-tolerant varieties, adjusted canopy management, diversified planting sites |
| Olive fruit fly and pests | Fruit damage, lower extractable oil, downgraded quality | IPM traps, biological controls, sanitation, optimized harvest timing |
| Labor cost inflation | Rising per-acre operating costs, pressure on margins | Increase mechanization, streamline workflows, use cooperative crews |
| Certification and compliance burden | Added overhead, risk of losing organic status or premiums | Robust recordkeeping, digital documentation tools, proactive certifier communication |
| Weak market access | Organic premium lost to bulk pricing, cash-flow instability | Build direct-to-consumer and specialty retail channels, negotiate multi-year contracts, develop a recognizable brand |
| Quality control failures | Oil downgraded from extra virgin, lower realized prices | Reduce harvest-to-crush time, use modern mills, implement quality testing protocols |
The biggest drivers of profit are pretty simple: water control, oil quality, and access to buyers willing to pay premium prices.
Conclusion: Is Organic Olive Farming Financially Viable?
Yes - but only when production runs well and sales channels support premium pricing.
The farms most likely to struggle tend to sell undifferentiated bulk oil, work in water-scarce areas without efficient irrigation, or lack direct access to buyers who pay for quality. On the other hand, farms with better odds of doing well treat cost control, product quality, and market access as just as important as growing the olives themselves.
For U.S. growers ready to invest in all three, organic olive farming can produce solid long-term returns. It’s a slow build, but the economics can work when the fundamentals are in place.
FAQs
What size grove is usually needed to make organic olive farming work?
There’s no one-size-fits-all minimum grove size for organic olive farming. A small grove can work, and so can a large one. What matters more is how you run it, how closely you manage costs, and how you plan to sell what you produce.
Some growers with low-density, older-style groves go after premium olive oil prices. Others use intensive systems to push for higher yields and lower cost per kilogram. In plain terms, financial success comes from the balance between what you spend - like certification, labor, and upkeep - and what the market will pay for your harvest.
How much working capital should I plan for before the grove turns cash-flow positive?
Plan for high upfront costs and steady yearly expenses before the grove starts making money.
Set aside room in your budget for:
- Annual certification fees of $330 to $1,100
- Quality control costs of up to $10,000 per year
- Initial application fees of $550 to $2,200
Olive oil prices can swing, and harvests don't always go your way. That means you'll want enough cash on hand to get through crop losses, weak pricing, or both during organic farming's long investment period.
What sales strategy gives organic olive growers the best chance at higher margins?
Organic olive growers can improve margins by earning third-party certifications like PDO or PGI. These labels verify authenticity and quality, and they can support price premiums of 20% to 50%.
Regenerative practices like no-till and cover cropping can also improve net income by cutting input and operating costs. Put those moves together, and growers have a stronger way to stand apart from lower-quality, mislabeled oils.