

Biological Treatment of Olive Mill Wastewater
Olive mill wastewater is hard to treat in one step. It can contain 40,000 to 220,000 mg/L COD, sometimes up to 300,000 mg/L, plus 0.5 to 24 g/L phenolics that slow or stop many microbes.
Here’s the short answer: the best results usually come from staged biological treatment. I’d sum the research up like this:
- Aerobic systems are used mainly for COD reduction and partial phenol removal.
- Anaerobic digestion is used for high organic load treatment and biogas production, but phenols can disrupt methane-forming microbes.
- Fungi and enzymes are often used first because they target phenols, dark color, and toxicity better than standard bacterial systems.
- Microalgae fit best as a polishing step, especially after earlier treatment lowers toxicity and improves light penetration.
- Mixed cultures usually hold up better than single strains when wastewater quality shifts during the olive season.
- Dilution, equalization, and pretreatment are common because raw OMW is often too strong for direct biological treatment.
The main pattern is simple: bulk COD can drop a lot while color still stays dark. That’s why many studies now lean toward a train such as enzyme or fungal pretreatment → anaerobic treatment → aerobic polishing → final polishing with microalgae or wetlands.
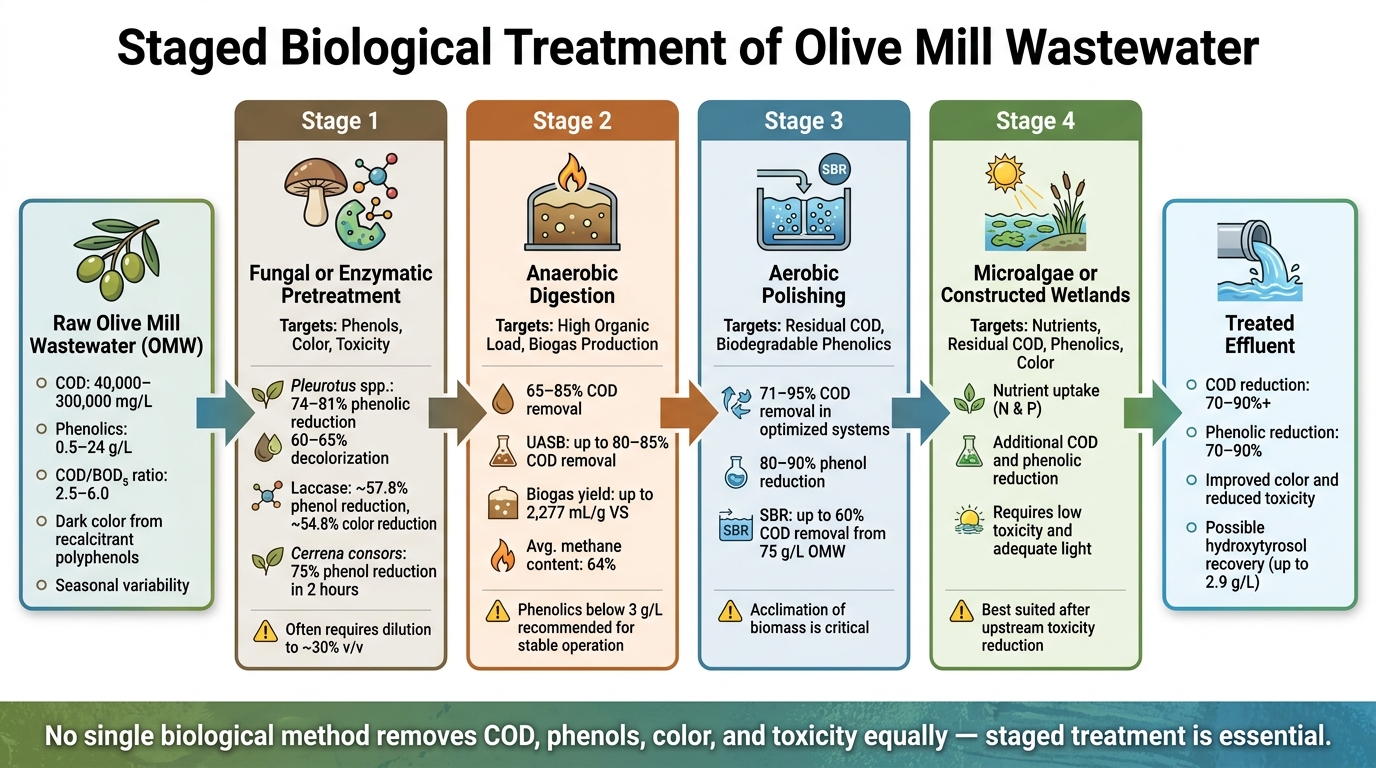
Staged Biological Treatment Train for Olive Mill Wastewater
Olive mill waste (OMW) management
sbb-itb-4066b8e
Quick Comparison
| Method | Best at | Typical limits |
|---|---|---|
| Aerobic bacteria | COD removal, some phenol reduction | Weak color removal, sludge production |
| Anaerobic digestion | High-load COD treatment, biogas | Phenolic inhibition, unstable at load swings |
| White-rot fungi | Phenols, color, toxicity | Lower COD removal, often needs dilution |
| Enzymes | Fast attack on phenols and color | High phenol levels can inhibit activity |
| Microalgae | Final polishing, nutrient uptake | Needs light and lower toxicity |
| Mixed consortia | Multi-target treatment | Results vary by wastewater and setup |
A few numbers help show the trade-offs. Some aerobic systems report 71% to 95% COD removal. Anaerobic systems often land around 65% to 85% COD removal. Fungal treatment can reach more than 60% phenol reduction and about 40% to 65% color removal. In some staged systems, studies report 70% to 90% reductions across COD and phenolics.
So if you want the plain takeaway, it’s this: <u>OMW treatment works best when each biological step does a different job</u>. One step cuts phenols, another handles organic load, and a final step cleans up what’s left.
Olive Mill Wastewater: Properties and Treatment Challenges
OMW is a dark, high-strength wastewater from olive oil extraction, and its basic properties make biological treatment hard from the start. Its COD usually falls between 40,000 and 220,000 mg/L, and in stronger streams it can reach 300,000 mg/L. COD/BOD₅ ratios of 2.5 to 6.0 point to low biodegradability. Electrical conductivity can go beyond 17 mS/cm, while suspended solids and lipids get in the way of oxygen transfer and make sludge handling messier. Put simply, this is not the kind of wastewater microbes handle easily.
High Organic Load, Phenolics, and Color
A big part of the problem comes from phenolics, which drive much of OMW's biological toxicity. Total phenolics range from 0.5 to 24 g/L, and some plant-level characterizations report values around 11 g/L. Low-molecular-weight phenols, including catechol, can damage cell membranes, disrupt enzyme activity, and interfere with energy metabolism in bacteria, fungi, and microalgae. The result is slower growth and harder acclimation.
OMW's dark color is another stubborn issue. It comes from recalcitrant polymeric phenols and lignin-like compounds that can remain even after major COD reduction. That means a system may cut organic load but still leave behind a dark effluent. And as OMW shifts from diluted to undiluted conditions, color removal can fall from nearly 40% to about 10%, while COD removal starts to vary more from run to run.
Seasonal Variability and Its Effects on Treatment
Seasonality adds another layer of difficulty. During peak milling periods, pollutant loads go up and pH drops, which leads to wastewater that is both more concentrated and more inhibitory. Outside the production season, stored OMW may partly ferment and settle, changing its composition and making study-to-study comparisons harder.
For biological reactors, that swing creates a tough operating pattern. Microbial communities need time to acclimate, but the seasonal on-off cycle can lead to biomass loss and force annual restarts. In practice, operators try to soften the shock by using gradual loading increases, dilution with other waste streams, or equalization tanks ahead of the biological stage. Those shifts in composition and loading play a big role in deciding which microbial and enzymatic systems can work in the next step.
Microbial Treatment Pathways in Recent Research
Recent research looks at a simple but hard problem: which biological pathway can handle OMW without breaking down under phenolic stress, while still removing COD, phenolics, and color.
Aerobic and Anaerobic Biotreatment
Aerobic systems are mostly tested for oxidation, detoxification, color removal, and phenolic reduction. They usually work best after the microbial community has adjusted to OMW. That adjustment matters a lot because raw OMW can hit a system like a punch.
Sequencing batch reactors (SBRs) get a lot of attention here. Their fill-and-draw operation gives operators close control over reaction and settling, which helps limit shock loading and lets the biomass deal better with changing influent. In one study, an acclimated SBR removed up to 60% of COD from 75 g/L OMW over 30 days. A rebuilt bacterial consortium performed about as well as acclimated activated sludge, which points to cultivable bacteria as the main drivers of degradation.
Anaerobic digestion goes after the same waste stream from another angle. Instead of focusing first on oxidation, it handles high organic loads while also making biogas. The most studied setups include UASB reactors, CSTRs, fixed-bed systems, and hybrid reactors. When OMW is diluted, pretreated, or co-digested, COD removal often lands in the 70%–90% range. Reported biogas data include a maximum yield of 2,277 mL/g VS and 0.97–0.99 L of biogas per g VS eliminated, with an average methane content of 64%.
The catch is phenolic inhibition. If loading rises too fast, phenolics can acidify the reactor and throw off methanogenesis. One study also found that floc-forming sludge did better than granular sludge with untreated OMW, producing 68.5 mL versus 45.7 mL of biogas. Research further suggests that OMW with total phenolics below 3 g/L can often be treated anaerobically after simple dilution, while streams with higher phenolic content usually need pretreatment first. Put plainly, the reactor shell matters, but the microbes inside it matter more.
Bacteria, Yeasts, Fungi, and Microalgae
Different microbial groups do different jobs, and mixed consortia usually beat single strains because they combine multiple metabolic routes.
Bacteria tend to drive most COD and BOD removal, especially for the more biodegradable share of the waste, in both aerobic and anaerobic systems. Yeasts can help detoxify phenolic-rich streams. For example, aerobic pretreatment with Candida tropicalis in an 18 L batch reactor at 86°F (30°C) over 12 days reached 62% COD removal and a 51% reduction in total mono-cyclic phenols. After that, the combined process reached 85% COD removal and 29 L of biogas per L of reactor per day during anaerobic co-digestion.
Fungi bring oxidative enzymes that can break down harder aromatic structures. Microalgae are studied mostly for nutrient uptake, especially nitrogen and phosphorus, and for extra COD reduction in high-rate ponds or photobioreactors. In those systems, photosynthesis can also supply oxygen to bacteria. So the pattern is fairly clear:
- Aerobic systems lean toward detoxification
- Anaerobic systems lean toward biogas recovery
- Mixed consortia tend to hold up better when influent conditions shift
Enzyme-driven and fungal treatments build on these same pathways by attacking the most recalcitrant compounds.
Enzymatic and Fungal Degradation Methods
Building on microbial pathways, enzyme-based and fungal methods go after the stubborn phenolics and dark color in OMW that often survive standard biological treatment.
Laccases, Peroxidases, and Other Oxidative Enzymes
Recent work looks mostly at laccases and peroxidases, especially manganese peroxidase (MnP) and lignin peroxidase (LiP). Laccases oxidize phenolics and help reduce color. Peroxidases need hydrogen peroxide as a co-substrate, and they tend to work well against the compounds that give OMW its dark appearance.
One practical point stands out: laccases can be reversibly inhibited when phenolic concentrations are too high. That means dilution is often part of the setup. Bringing OMW down to about 30% before enzyme dosing helps reduce inhibition. In one laccase pretreatment study with diluted OMW, researchers found a 57.79% ± 2.21% reduction in phenols and a 54.79% ± 3.44% reduction in dark coloration.
Peroxidases behave a bit differently. They can stay active even under high phenolic loads and can deliver strong decolorization when H₂O₂ is added, even if phenolic removal stays limited. That split in performance helps explain why paired laccase-peroxidase systems look promising: one helps with phenols, the other can push color removal further.
When purified enzymes hit their limits, fungi step in and carry out similar oxidative reactions inside a living system.
White-Rot Fungi and Combined Biological Treatment Trains
White-rot fungi get a lot of attention because they secrete ligninolytic enzymes. Species such as Pleurotus spp., Phanerochaete chrysosporium, and Cerrena consors have all shown treatment effects.
The reported results are strong:
- Pleurotus species achieved 74–81% phenolic reduction and 60–65% decolorization in batch cultures.
- Cerrena consors reached 75% phenol reduction within 2 hours and 80% total phenol removal after 15 days, while phytotoxicity fell 84% by day 15.
- Phanerochaete chrysosporium treatment produced about 60% COD removal, 60% color reduction, and 32% total phenolic degradation.
Recent research leans more toward combined treatment trains than standalone fungal or enzyme steps. In practice, enzymatic pretreatment is often used upfront to make the effluent easier to polish later. In one combined-treatment study, laccase pretreatment of diluted OMW cut phenols and dark coloration by about 57.8% and 54.8%, respectively, before a microalgal polishing stage. Lower phenolic levels help microalgal polishing because toxicity drops and light penetration improves.
Enzymatic treatment can also shift from removal to recovery. Instead of just breaking phenolics down, some systems pull out compounds with market value. For example, Aspergillus niger β-glucosidase increased hydroxytyrosol from 0.015 g/L to 2.9 g/L under optimized conditions. That points to biorefinery use cases where part of wastewater treatment also recovers useful phenolics. The catch is that results still depend heavily on load, dilution, and reactor design, which makes side-by-side method comparison important.
Comparing Biological Methods: Findings, Limits, and Research Directions
How Biological Methods Compare Across Key Performance Metrics
Once the main microbial and enzymatic pathways are clear, the next issue is simple: which method works best for which pollutant?
The short answer is that no single biological method handles COD, phenols, color, and toxicity equally well.
Aerobic systems such as activated sludge, sequencing batch reactors, and membrane bioreactors usually perform best on bulk organic removal. In optimized setups, they deliver COD removal in the 71–95% range, with phenol reduction around 80–90%. The catch is color. These systems tend to struggle with dark, persistent pigments.
Anaerobic digestion is also strong on bulk organic matter. Typical COD reduction falls around 65–85%, and well-operated UASB reactors can reach about 80–85% COD removal. But there’s a catch here too: phenolic inhibition can upset the process when the influent shifts, which is a common problem in this type of wastewater.
Fungal and enzymatic methods go after a different part of the problem. They are better suited for phenols and color. White-rot fungi often reduce phenolics by more than 60% and can cut color by roughly 40–65%, though COD removal is usually lower and depends a lot on dilution and contact time. Mixed microbial consortia try to bridge that gap by combining different metabolic functions. One reported formulation reached 85% COD removal, 67% phenol reduction, and 43% toxicity reduction.
The summary below makes those trade-offs easier to see.
| Treatment Method | Main Organisms/Enzymes | Primary Targets | Strengths | Limitations |
|---|---|---|---|---|
| Aerobic (SBR, MBR, CAS) | Mixed aerobic bacteria | COD, lower-molecular-weight phenolics | High COD removal; mature process | Weak on color; more sludge |
| Anaerobic digestion (UASB, filters) | Anaerobic consortia | COD, biogas | Strong COD reduction; energy recovery | Phenolic inhibition; variable phenol removal |
| White-rot fungi (Pleurotus, Ganoderma, Cerrena) | Ligninolytic fungi | Phenols, color, toxicity | Strong phenol and color reduction | Moderate COD removal; needs dilution |
| Enzymatic (laccases, peroxidases) | Fungal enzymes | Phenols, dark color | Rapid, targeted chromophore degradation | Sensitive to high phenolic loads |
| Microalgae (Chlorella spp.) | Microalgae | Phenols, nutrients, toxicity | Biomass valorization; polishing stage | Needs dilution; light-dependent |
| Mixed microbial consortia | Bacteria + yeasts | COD, phenols, toxicity | Broad-spectrum removal; stress tolerance | Performance varies by formulation and influent |
Current Limits and the Most Promising Next Steps
Because color and toxicity often remain after bulk COD removal, the field is moving toward integrated treatment trains instead of single-step systems.
Study after study points to the same pattern: one biological step alone usually does not meet discharge standards. Even a three-step biological train that combined fungal pretreatment, an anaerobic filter, and activated sludge reached roughly 90% COD reduction, yet the effluent still stayed intensely black because high-molecular-weight polyphenolic polymers remained. That’s the heart of the issue. COD and phenols can drop a lot, but color is often harder to remove than COD.
A few limits show up again and again in the literature. High phenolic concentrations inhibit both aerobic and anaerobic microbes. Many fungal and enzymatic systems are tested on diluted wastewater, often around 30% v/v, because undiluted olive mill wastewater can reach COD values of 80–300 g/L and is too toxic for the biological agents being used. On top of that, olive crushing is seasonal, so influent composition can shift from one batch to the next. That makes stable reactor performance tough without equalization tanks and flexible process control.
The direction getting the most support is a sequenced biological train. In practice, that means using fungal or enzymatic pretreatment first to lower phenolics and color, then following with anaerobic and aerobic stages for bulk COD removal, and finishing with a polishing step such as microalgae or constructed wetlands. These sequential systems have reported 70–90% reductions in COD and phenolics, along with clear gains in color and toxicity. Mixed consortia and enzyme-assisted systems also help by bringing in complementary metabolic pathways and better tolerance to inhibitory compounds.
Most of the evidence still comes from bench and pilot work, though, because full-scale data are still scarce.
Conclusion: What Recent Research Supports
Recent research points in the same direction: OMW is hard to treat in one step. Its high COD and phenolic load make single-step biological treatment fall short. In plain terms, those concentrations slow microbial activity and get in the way of treatment.
That’s why staged systems keep standing out in the data.
Optimized fungal systems have reached 98% COD removal and 96% phenolic removal within 12 days. Fungi seem to work best on phenols and color, and their enzymes can push that effect further before later polishing stages.
Enzymatic pretreatment also makes downstream treatment easier. Laccases can cut phenols and color before later biological polishing. After that, microalgae systems can help polish what’s left, including residual nutrients, COD, and phenolics.
Put it all together, and the message is pretty clear: stage the treatment. Using fungal or enzymatic pretreatment before anaerobic and aerobic phases, then ending with a polishing step, delivers the best overall reduction across COD, phenolics, color, and toxicity. Some studies also report recovery of hydroxytyrosol from OMW.
One caveat matters here. Most of the strongest results still come from bench and pilot studies, while full-scale, long-term data are still scarce.
FAQs
Why can’t olive mill wastewater be treated in one step?
Olive mill wastewater can’t be treated in a single step. Its makeup is complex, and the pollution load is high, so a multi-stage approach is needed for safe, effective treatment.
The wastewater contains organic pollutants such as sugars, acids, and high levels of phenolic compounds. Those phenols can interfere with biological treatment, which is why they often need dilution or pretreatment first. On top of that, the high chemical oxygen demand means the wastewater usually has to move through several treatment phases instead of one.
Which biological method removes phenols and color best?
Based on the cited studies, systems like ALGATEC performed best, with nearly 100% removal of both turbidity and phenols.
Multi-step membrane setups also did very well. Nanofiltration removed more than 95% of phenols, while reverse osmosis achieved complete removal of phenols and suspended solids.
Why is a staged treatment train usually recommended?
A staged treatment train is usually the best way to handle olive mill wastewater. The main reason is simple: this wastewater carries very high organic loads and phenolic compounds, and both can interfere with biological treatment.
Breaking treatment into separate phases makes the system easier to control. For example, operators may start with a growth phase and then introduce the wastewater bit by bit. Another common setup splits the process into hydrolytic digestion first and methanogenic digestion after that.
That step-by-step approach helps in a few key ways:
- It manages pollutant loads more evenly
- It lowers inhibitory effects on biological activity
- It helps keep microbial or enzymatic activity stable and effective
Put plainly, instead of asking one treatment step to do everything at once, staging lets each phase handle a smaller part of the job. That often leads to steadier process performance when dealing with a hard-to-treat stream like olive mill wastewater.