

Membrane Filtration for Olive Mill Wastewater
Olive mill wastewater is hard to treat, but membrane systems can cut COD by more than 99%, drop phenols to under 10 mg/L, and recover about 60%–70% of the water.
If I had to sum up the research in one line, it would be this: stacked membrane steps work best, especially when mills use MF, UF, NF, and RO in sequence. The early steps pull out solids, oils, and larger organics. The later steps strip out dissolved pollutants and leave water that may be reused for irrigation or plant washing, depending on local limits.
Here’s the short version:
-
OMW is highly polluted
- COD often falls between 60–220 g O₂/L
- Phenols often range from 2–12 g/L
- pH is usually 3–6
-
Single-step treatment is often not enough
- OMW has poor biodegradability
- Seasonal surges make storage and treatment harder
-
Membrane trains are the main answer in the studies
- MF/UF: remove solids, oil droplets, colloids, and some larger organics
- NF/RO: remove dissolved organics, salts, and most remaining phenols
-
Main results reported
- Final COD can fall from more than 32,000 mg/L to about 280 mg/L
- Phenols in RO permeate can drop to less than 10 mg/L
- Water recovery is often 60%–70%
-
Main downside
- Fouling is the big problem
- Flux losses reported in studies reached about 22% for UF and 64%–65% for NF
- More cleaning means more cost
The Ultimate Guide of Membrane Filtration. A must in every Water Treatment Train?
sbb-itb-4066b8e
Quick Comparison
| Step | What it removes | Pressure | Main role | Limits |
|---|---|---|---|---|
| MF | Suspended solids, pulp, oil droplets | 0.5–2 bar (about 7–29 psi) | First cleanup step | Limited effect on dissolved phenols |
| UF | Fine colloids, proteins, polysaccharides, some larger phenols | 1–3 bar (about 15–44 psi) | Protects later membranes | Does not finish the job alone |
| NF | Dissolved organics, multivalent ions, larger phenols | 8–25 bar (about 120–360 psi) | Deep polishing and phenol concentration | Higher energy use, fouling risk |
| RO | Remaining organics, salts, trace phenols | 20–40 bar (about 290–580 psi) | Final water cleanup | Highest pressure and cleaning demand |
What stands out to me is simple: membranes can turn a disposal problem into two streams - cleaner water and a phenol-rich concentrate that may have sale or reuse potential. But the system only holds up if fouling is kept under control and the cost per treated gallon stays in line.
Membrane Filtration Methods Used in OMW Studies
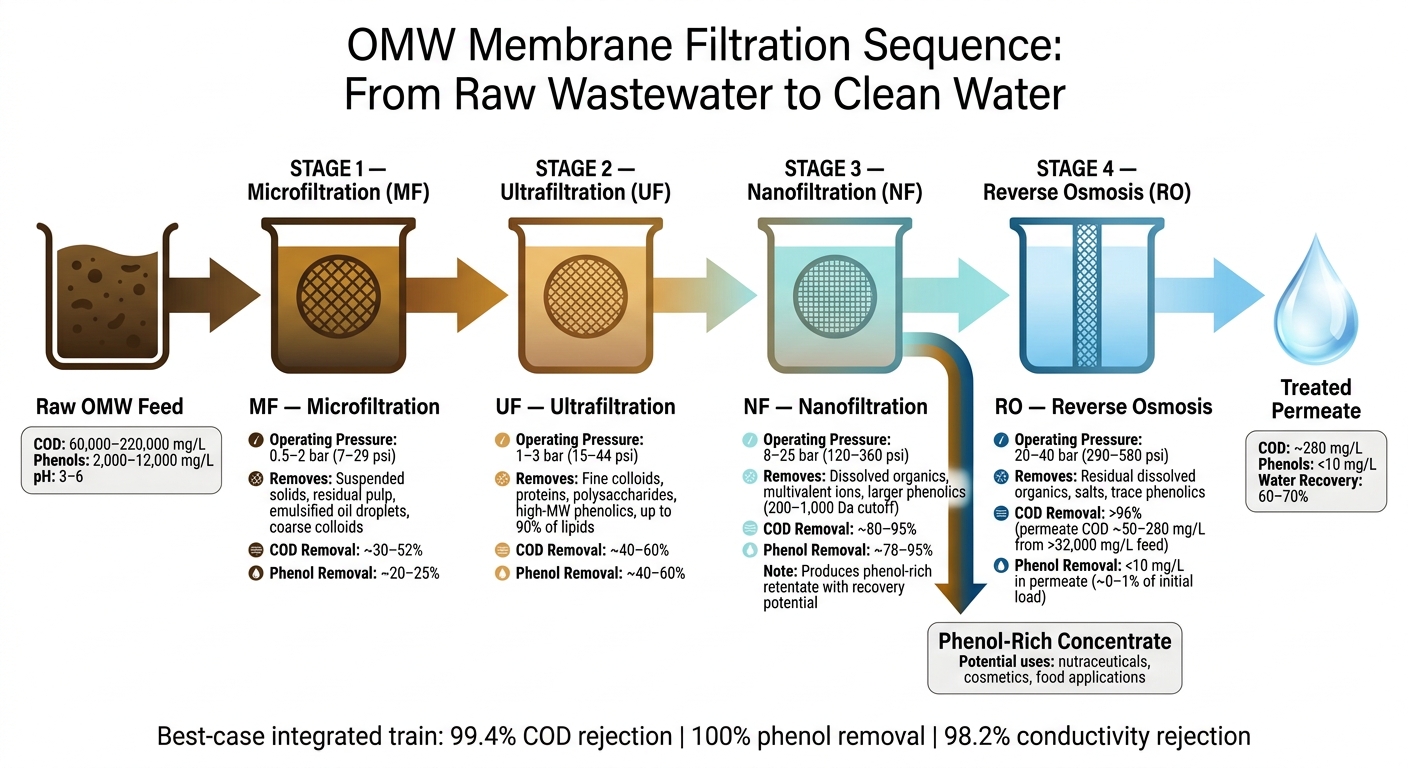
Membrane Filtration Train for Olive Mill Wastewater: Step-by-Step Treatment
OMW studies usually apply four pressure-driven membrane steps in sequence: microfiltration (MF), ultrafiltration (UF), nanofiltration (NF), and reverse osmosis (RO). Each step goes after smaller pollutants than the one before it. So the pattern is pretty simple: MF and UF handle the heavier load first, then NF and RO clean up what’s left.
Microfiltration and Ultrafiltration for Solids and Larger Organics
MF is often the first clarification step. It uses larger pore sizes to remove suspended solids, residual pulp, emulsified oil droplets, and coarse colloidal particles. In one staged MF train, researchers removed 99% of suspended solids and cut COD by about half. That makes MF a strong first filter, but there’s a catch: it mostly holds back organics attached to particles. Most dissolved phenolics still move through with the permeate. That clarified stream then goes to UF.
UF comes next and works with smaller pore sizes. It retains fine colloids, proteins, polysaccharides, and higher-molecular-weight phenolic compounds while letting smaller dissolved molecules and salts pass. In OMW studies, UF often removes 40–60% of both COD and phenols, though results shift with pressure and feed quality. UF can also remove up to 90% of lipids and about half of phenolics. Put another way, MF and UF do the heavy lifting up front so the later high-pressure stages don’t get overwhelmed.
Nanofiltration and Reverse Osmosis for Deeper Cleanup
After MF and UF cut down the bulk load, NF takes aim at dissolved organics. It usually runs at about 8–25 bar (120–360 psi), and its membranes typically have cutoffs of 200–1,000 Da. That lets NF reject most larger dissolved organics and multivalent ions while allowing monovalent salts to pass. In integrated MF–UF–NF systems, NF has delivered COD rejection above 90% and phenol removal above 78%. It can also produce a retentate rich in polyphenols, which opens the door to recovery rather than simple disposal.
RO is the last step and the tightest membrane in the train. It runs at 20–40 bar (290–580 psi) and targets almost all remaining dissolved organics and salts. In one integrated treatment train for two-phase OMW, RO permeate reached about 280 mg/L COD, down from more than 32,000 mg/L in the feed. Phenolic content in RO permeate can drop to less than 10 mg/L, or about 0–1% of the initial load. At that point, the water may be fit for non-potable reuse, such as washing water, process-water blending, or irrigation of less-sensitive crops, depending on local rules.
Membrane Comparison Table
| Membrane | Primary Targets | Operating Pressure | COD Removal | Phenol Removal | Likely Water End Use |
|---|---|---|---|---|---|
| MF | Suspended solids, oil droplets, coarse colloids | 0.5–2 bar (~7–29 psi) | ~30–52% | ~20–25% | Feed to UF or downstream polishing |
| UF | Fine colloids, proteins, polysaccharides, high-MW phenolics | 1–3 bar (~15–44 psi) | ~40–60% | ~40–60% | Feed to NF; solids and lipid removal |
| NF | Dissolved organics, multivalent ions, larger phenolics | 8–25 bar (~120–360 psi) | ~80–95% | ~78–95% | Polishing feed; phenolic concentrate recovery |
| RO | Residual dissolved organics, salts, trace phenolics | 20–40 bar (~290–580 psi) | >96%; permeate COD ~50–280 mg/L | Phenolics <10 mg/L (~0–1% of initial) | Non-potable reuse, on-site process water |
One integrated train reported 99.4% COD rejection and 100% phenol removal in the final permeate, with conductivity rejection reaching 98.2%. Those step-by-step results set up the study comparison in the next section.
What Published Studies Report About Performance
Results from Integrated Treatment Trains
Published studies show a clear pattern: staged membrane trains do better than single-membrane setups for OMW. That lines up with the staged MF, UF, NF, and RO approach described above. Each step removes what the last step missed, so performance gets better as the stream moves through the train.
But configuration isn't the whole story. Operating conditions can make or break results. One pressure-driven membrane optimization study showed just how big that gap can be. Under the right conditions, the system reached 83.3% COD removal and 93.1% total phenol removal. Under milder conditions, performance fell to 20.6% and 26.8%, respectively. That's a huge swing, and it shows how much feed quality and operating settings affect the outcome.
A separate pilot treatment of two-phase OMW reported that COD dropped from >32,000 mg/L to <280 mg/L, while total phenolic content fell below 10 mg/L. From there, the key question becomes simple: how much usable water can the train recover?
Water Recovery, Permeate Quality, and Reuse Potential
Full-train studies report 60%–70% water recovery at the final RO or NF stages. The recovered water also shows a much lower organic load, less color, and much lower toxicity than the raw feed. In plain terms, the water coming out looks and behaves much cleaner than the water going in.
A 2006 pilot-plant study using a UF-NF-RO sequence found that about 80% met irrigation standards. At the same time, the concentrate streams retained most of the leftover organics and phenolics. That's often the tradeoff in membrane systems: cleaner permeate on one side, more concentrated waste on the other.
Researchers usually check permeate quality through measures such as COD, BOD, phenolic content, conductivity, color, and turbidity. In some studies, they also use phytotoxicity assays. Final reuse still depends on local limits, especially for salinity and residual phenolics.
Typical reuse options include:
- On-site irrigation of olive groves
- Other non-potable uses
Water recovery only matters if the permeate stays low in salts, color, and organics.
Case Study Results Table
The studies below show how scale, setup, and feed type shape the results.
| Study / Configuration | Scale | Feed Type | COD Removal | Phenol Outcome | Water Recovery | Permeate Use |
|---|---|---|---|---|---|---|
| UF→NF→RO pilot plant | Pilot | Raw OMW | Not specified | Concentrated in retentate | ~80% of treated volume met irrigation standards | Irrigation reuse |
| MF→UF→NF sequence | Lab/pilot | Raw OMW | MF: 52%; UF: 50.2%; NF: >90% (cumulative) | UF: 60.8% removed; NF: 78.3% removed | Not specified | Discharge or further polishing |
| Pressure-driven membrane optimization | Lab | Pretreated OMW | Up to 83.3% (best case) | Up to 93.1% removed (best case) | Not specified | Reuse-oriented |
| UF→NF→RO integrated train | Pilot | Two-phase OMW | >99%; final COD ~280 mg/L from >32,000 mg/L feed | Final TPC <10 mg/L | ~60%–70% (RO stage) | Near-clean water; non-potable reuse |
| RO polishing study | Lab | Pretreated OMW | Not specified | RO permeate: 0%–1% of original phenols; RO retentate: ~2.6× concentrated | Not specified | Phenolic recovery from retentate |
Limits, Fouling, and Cost of Membrane Treatment
Why Fouling Is the Main Technical Barrier
Membrane systems can produce clean permeate, but OMW tends to foul membranes fast. Oils, polyphenols, solids, colloids, and minerals build up on the membrane surface or inside the pores.
The literature keeps pointing to three main fouling routes. The first is organic fouling, where oils and polyphenols stick to membrane surfaces. The second is particulate and colloidal fouling, where suspended matter forms a cake or gel layer. The third is concentration polarization and scaling, where dissolved salts collect near the membrane surface and start causing deposits. If pretreatment is weak or missing, fouling can get so bad that raw OMW processing reaches near-zero flux. A 2025 review also reported that UF fouling in OMW can form a dense, mineral-rich pectin gel layer.
Flux decline often shows a two-step pattern. There is a steep drop at the start, followed by a slower decline until the system reaches a quasi-steady state. In published studies, UF membranes showed about 22% flux decline, while NF membranes lost as much as 64–65% of their flux as the feed became more concentrated.
Cleaning helps, but it does not fix everything. NaOH cleaning at 104°F (40°C) restored flux in one study and delivered near-full flux recovery in another. Still, some fouling stays behind and builds up over time. That affects how often membranes need to be replaced and cuts system uptime. Put simply, the more cleaning a plant needs, the more it costs to keep it running.
How Studies Assess Economic Feasibility
Economic studies on OMW membrane systems usually split costs into two buckets: capital cost and operating cost. Capital cost includes membrane modules, pumps, pressure vessels, and pretreatment units. Operating cost covers electricity, cleaning chemicals, labor, and membrane replacement. Most studies report the result as $/m³ of treated wastewater.
In practice, energy use and cleaning frequency do most of the damage to the budget. NF and RO need higher operating pressures, so electricity use per cubic meter goes up. When fouling gets worse, plants need more clean-in-place (CIP) cycles, more chemicals, and more frequent membrane replacement. MF and UF are cheaper to operate, but the tradeoff is lower permeate quality, which narrows the reuse options.
That’s why many systems use integrated treatment trains. They try to balance cost and performance. But the math only works if upstream fouling control is good. If not, the extra stages can start to feel like paying more to fight the same problem.
Another path to better economics is value recovery from the concentrate. Retentate from NF and RO is rich in polyphenols and other bioactive compounds. If those fractions are recovered for supplement, cosmetic, or food uses, they can offset part of the treatment cost. In other words, the concentrate may be more than just a disposal headache. It can also be part of the business case.
Pros and Cons Table
| Factor | Advantage | Disadvantage |
|---|---|---|
| Removal efficiency | Very high COD and phenol removal, especially with NF/RO | Performance drops without pretreatment |
| Footprint | Compact footprint with high treatment capacity per unit membrane area | Pretreatment and staging add equipment complexity |
| Water reuse | Deep treatment can produce permeate suitable for process reuse or irrigation | MF/UF alone usually do not achieve reuse-quality permeate |
| Polyphenol recovery | Concentrates can be recovered for higher-value uses | Concentrate still requires separate handling, disposal, or further treatment |
| Fouling | Manageable with pretreatment and cleaning protocols | Irreversible fouling accumulates over time, raising replacement costs |
| Capital cost | Costs depend on process configuration and scale | Integrated trains carry big upfront cost |
| Energy demand | MF/UF stages operate at low pressure | NF/RO stages require higher pressure, increasing electricity use |
Those tradeoffs shape the environmental case for membrane reuse.
Environmental Value and What It Means for Olive Oil Producers
Environmental Benefits and Circular Economy Uses
Membrane filtration can turn olive mill wastewater into reusable water and a concentrate that still has use. The payoff comes down to separation: the better the membrane train removes solids, organics, and dissolved compounds, the more use a producer can get from both streams.
Integrated systems can cut COD sharply, recover most of the water, and keep pollutants in a concentrated retentate. That matters on the ground. Instead of treating wastewater as a dead-end cost, producers can pull out a stream that may be recovered or put to work elsewhere.
The main recovery stream is the phenol-rich retentate. Recovered polyphenols can be used in:
- nutraceuticals
- cosmetics
- food applications
- weed-control products
Those uses have been reported across the research. The permeate, meanwhile, can replace freshwater for washing or irrigation where local rules permit it.
Why This Research Matters for Premium Olive Oil Brands
For producers, this matters because wastewater management affects day-to-day operations and how the brand is seen. It’s not just about disposal. It touches water use, process control, and how much value can be pulled from byproducts.
For premium brands such as Big Horn Olive Oil, wastewater stewardship supports quality, freshness, and responsible production. That link is easy to see: when a producer pays close attention to what happens after milling, it signals care across the whole process.
Conclusion: Key Findings from the Research
The studies line up on two main points: integrated membrane trains can deliver strong cleanup, and fouling plus cost are still the biggest barriers. That’s the tradeoff in plain terms. The systems can do a lot, but they need to work well enough, and cheaply enough, for producers to keep using them at scale.
The strongest case for these systems is cleaner discharge, water reuse, and value recovery from the concentrate. When producers treat concentrate as a co-product instead of a liability, the environmental upside becomes more durable.
FAQs
Why does olive mill wastewater need multiple membrane steps?
Using more than one membrane step improves treatment efficiency and water quality. It starts with pre-treatment, which removes larger particles and helps cut down on clogging. After that, membrane filtration separates clean water from a concentrated stream of useful compounds.
A final polishing step, such as pH adjustment or activated carbon, further refines the permeate so it can be safely reused for washing olives or cleaning equipment.
Can the treated water be reused on-site?
Yes. Membrane filtration separates clean water, or permeate, from olive mill wastewater.
After polishing steps like pH adjustment or fine filtration, that water can be reused for non-critical jobs such as washing olives and cleaning equipment.
Some advanced systems can also produce water suited for agricultural irrigation, which helps the mill use less water overall.
What makes membrane fouling hard to control?
Membrane fouling is tough to control in olive mill wastewater treatment because this wastewater is a messy mix of contaminants. It carries high levels of suspended solids, organic matter, lipids, phenolic compounds, sugars, and pectins, and those materials can pile up on the membrane surface fast.
The wastewater is also acidic, with a pH of 4 to 5.5, and it has a high organic load. That combination can cut filtration efficiency, which means operating conditions need close attention. In practice, pressure, cross-flow velocity, and pH all need to be managed with care.