

Olive Mill Wastewater Reuse: Impact Assessment
I would approve olive mill wastewater reuse only if it meets permit rules and causes less harm than compliant treatment or disposal. Before choosing a route, I would test the water, check soil and crop limits, and account for energy use and every waste stream.
Why start with testing? COD - a measure of organic pollution - commonly reaches 50–150 g/L. That is a warning about treatment needs, not an irrigation safety limit.
Here’s the checklist I would use:
- Define the use: irrigation, controlled land application, or reuse inside the mill.
- Check water and site risks: salts, phenols, nutrients, pathogens where relevant, crop tolerance, drainage, and groundwater.
- Match treatment to the use: confirm water quality and safe outlets for sludge, concentrates, and recovered products.
- Compare total impacts: track water savings, pollutant loads, energy, emissions, and costs per 264.17 U.S. gallons (1 m³) managed.
- Set approval and stop rules: require permits, seasonal storage, monitoring, and action when treatment fails or soil, crops, or groundwater show harm.
My bottom line: <u>recovering water is not enough</u>. I would count reuse as a sound choice only when it replaces a needed input without shifting pollution elsewhere.
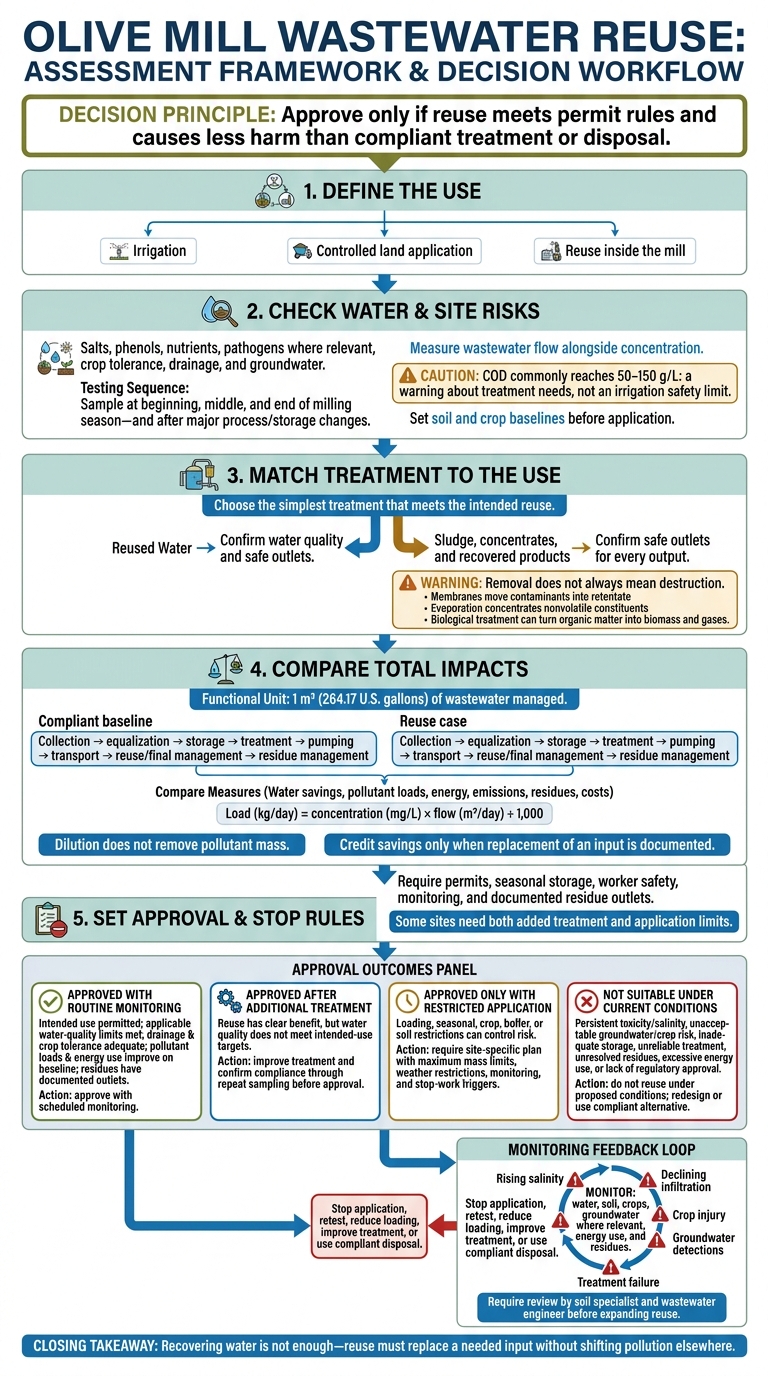
Olive Mill Wastewater Reuse: Assessment and Approval
Adventech | Olive Mill Wastewater Treatment
sbb-itb-4066b8e
Assess Water Quality and Soil Conditions
Once you’ve identified the wastewater profile, track how it changes during the milling season - and how the site responds.
Test Wastewater Throughout the Milling Season
Sample at the beginning, middle, and end of the milling season. Also sample after major changes in olive variety, maturity, extraction system, water use or dilution, or storage time. Use flow-weighted composite samples where feasible, and grab samples for startup, process changes, cleaning events, and storage discharge. Measure wastewater flow alongside concentration.
Use a certified laboratory with documented sampling and preservation procedures. Report concentrations in mg/L, along with pH and EC. Include methods, units, detection limits, sampling date, storage conditions, chain of custody, production and wastewater volumes, storage duration, temperature, treatment history, and whether the mill uses a two-phase or three-phase system.
| Parameter | Risk | Test method | Reuse concern | Priority |
|---|---|---|---|---|
| pH and EC | Acidity and salt stress | Calibrated pH electrode and conductivity meter | Crop tolerance and treatment performance | High |
| Total suspended solids | Clogging and surface buildup | Gravimetric analysis | Filtration and application equipment | High |
| BOD₅ and COD | Oxygen depletion | Five-day BOD and COD analysis | Soil oxygen, odors, and treatment needs | High |
| Total organic carbon | Excess organic loading | Laboratory TOC analysis | Carbon input and treatment performance | Medium-high |
| Nitrogen, phosphorus, potassium | Excess nutrient loading | Laboratory nutrient methods; instrumental potassium analysis | Crop nutrient budget and leaching | High |
| Sodium, calcium, magnesium, chloride | Soil-structure damage and salt stress | Inductively coupled plasma, atomic absorption, or equivalent analysis; ion chromatography for chloride | Sodium adsorption ratio (SAR) and crop tolerance | High |
| Phenolic compounds | Plant toxicity and microbial inhibition | Validated spectrophotometric or chromatographic method | Land application and residue persistence | High for land application |
| Pathogens, including indicator organisms | Exposure hazards | Applicable culture-based or molecular methods | Food crops and worker exposure | High where relevant |
Monitor Soil, Crop, and Groundwater Effects
Set a baseline before application. Sample soil at consistent locations and depths, such as 0–8 inches (0–20 cm) and 8–16 inches (20–40 cm). Sample deeper where leaching is a concern. Record crop condition and productivity, keep an untreated comparison area where practical, and use replicated plots where possible.
| Effect | Potential benefit | Potential harm | Trigger condition | Monitoring indicator |
|---|---|---|---|---|
| Soil pH | - | Altered nutrient availability | Persistent shift from baseline | Soil pH |
| Salinity and sodium | - | Root stress and weaker soil structure | Rising salts or exchangeable sodium | Soil EC, SAR, or exchangeable sodium percentage |
| Organic matter and nutrients | Improved fertility and water retention | Oxygen depletion and nutrient leaching | Inputs exceed crop demand; wet soil | Organic carbon, available N/P/K, deeper-soil nitrate |
| Phenolic residues | - | Root toxicity and microbial disruption | Persistent residues or poor emergence | Phenols, microbial activity, root growth |
| Infiltration | Improved structure under suitable conditions | Ponding, runoff, or water repellency | Slower water entry | Infiltration rate and aggregate stability |
| Crop performance | Better growth where deficiencies exist | Leaf injury, chlorosis, stunting, reduced yield | Decline relative to baseline or control | Crop emergence, vigor, leaf injury, chlorosis, fruit quality, yield |
| Groundwater | - | Nutrient, salt, or contaminant migration | Increase above background | Nitrate, chloride, EC, relevant phenols |
Include groundwater monitoring when shallow groundwater, permeable or fractured soils, large pollutant loads, or nearby wells increase risk. Have a qualified hydrogeologist establish upgradient background and downgradient sampling points.
Monitor more closely during the first season and after heavy applications or major rainfall. Rising contaminants, crop injury, or declining infiltration should prompt an investigation and reduced or suspended application.
Check Site Conditions and Permit Rules
Get written confirmation from state and local agencies about reuse classification, permits, setbacks, and monitoring requirements. Match laboratory results and treatment goals to crop tolerance, soil texture, drainage, application method, and seasonal demand. Require solids removal where equipment could clog. Avoid applying wastewater to saturated soil or before heavy rain.
State application rates in gallons per acre. One acre-inch equals 27,154 gallons per acre (254 m³/ha). Pair every volume with pollutant loading - not concentration alone. Dilution does not remove pollutant mass, so treatment, application limits, and buffers must address the site’s actual risks. Use those limits to rule out reuse routes the site cannot support.
Match Treatment to the Intended Reuse
Use water-quality and site results to match the treatment level and residues to the planned end use. Confirm water quality, soil conditions, and permit limits, then choose the simplest treatment that meets the intended reuse.
Compare Treatment Methods and Residues
| Treatment approach | What to verify | Residue or product to account for | End use |
|---|---|---|---|
| Two-phase centrifugation | Confirm lower wastewater volume and plan how to handle wet pomace. | Wet pomace | Waste minimization and solids handling |
| Pit recovery | Confirm that pits are clean and dry before using them as fuel. | Pits (stones) | Biomass fuel |
| Composting with bulking agents | Check compost stability, salinity, and nutrient content before applying it to land. | Finished compost | Soil amendment |
Wet pomace has high moisture content and phenolic toxicity, which make storage and reuse more difficult.
Check Reused Water and Recovered Product Safety
Check reused water and each recovered product against its planned use: irrigation, recirculation, compost, or fuel. Approve only streams that meet applicable water-quality, residue-handling, and safety requirements. Exclude streams that don't meet those requirements.
Once you've defined the reuse route, compare its energy use and residue burden with other options. After setting the treatment and residue routes, measure energy use and total pollutant loads before approval.
Calculate Energy Use, Pollutant Loads, and Total Impacts
Once the treatment route is set, calculate its energy use, material flows, and costs against the compliant baseline. The goal is to find out whether reuse reduces the total burden - not just water demand.
Apply the same system boundary to reuse and the mill’s compliant baseline: collection, equalization, storage, treatment, pumping, transport, reuse, and residue management. Use 1 m³ (264.17 U.S. gallons) of wastewater managed as the functional unit, based on full-season records. Document throughput, storage time, treatment capacity, transport distances, and the destination of every output.
Measure Energy Use and Costs
Meter electricity separately for influent and recirculation pumps, screening, mixing, aeration, centrifuges, membrane filtration, ultraviolet or electrochemical units, controls, and cleaning systems. Measure thermal energy separately for evaporation, thermal concentration, drying, or pasteurization. Also record fuel used to haul wastewater, recovered water, chemicals, and residues.
Report electrical and thermal energy separately in kWh/m³. Multiply each value by 3.78541 to express it in kWh per 1,000 U.S. gallons. Convert fuel-based thermal energy to kWh using documented fuel energy content, and explain the conversion method. Report recovered biogas, heat, or electricity separately from gross energy demand.
Calculate costs in $/m³ and $/1,000 U.S. gallons. Include annualized capital cost, utilities, labor, chemicals, maintenance, monitoring, and residue disposal. State equipment life, discount rate, and seasonal operating rate. Lower environmental impacts don’t guarantee lower costs.
Track Pollutant Mass and Waste Residues
Record concentration, flow, sampling date, analytical method, and detection limit. Calculate pollutant loads using:
Load (kg/day) = concentration (mg/L) × flow (m³/day) ÷ 1,000
Track COD, BOD5, TSS, phenols, nutrients, salts, and oil and grease in both incoming and outgoing streams - not just removal rates. Electrical conductivity helps assess salinity, but it does not measure salt mass. Label each inventory entry as measured, estimated, or inferred.
| Flow | Units | Data source | Impacts and accounting notes |
|---|---|---|---|
| Raw wastewater | m³; constituent kg | Flow meter; laboratory results | Organic load, toxicity, nutrients, salinity |
| Added water and chemicals | m³; kg | Meters; purchase and operating records | Water demand, chemical production, residuals |
| Electricity, heat, transport fuel | kWh; gallons of fuel | Submeters; fuel and trip records | Energy, climate, cost |
| Recovered water, energy, or materials | m³; kWh; kg | Meters; scales; use records | Credit only verified replacement of an input |
| Treated effluent | m³; constituent kg | Outlet meter; laboratory results | Remaining water-quality and nutrient loads |
| Sludge, concentrates, spent media | Wet/dry kg; moisture; constituent kg | Scales; characterization; destination records | Storage, hauling, recovery, disposal |
| Air emissions and biogas | Constituent kg; gas volume and composition | Gas meters; tests; documented models | Climate impact and verified energy credit |
| Storage changes | m³; constituent kg | Opening and closing inventories | Seasonal accumulation |
| Unexplained balance gap | m³ or kg; percentage | Calculated difference | Report separately and investigate |
Removal does not always mean destruction. Membranes move contaminants into retentate. Evaporation concentrates nonvolatile constituents. Biological treatment can turn organic matter into biomass and gases. Document these changes before reconciling each water or constituent balance.
COD measures oxygen demand, so don’t balance it directly against kilograms of gas. Count dilution as added water, not pollutant removal. Set an investigation threshold supported by the quality of your measurements:
For instance, a 5%–10% balance gap.
Investigate missing flows rather than treating them as recovery. Use these inventories for the life-cycle comparison below.
Compare Life-Cycle Impacts
Compare both scenarios using the defined functional unit and the same geography, time period, and system boundary. Use life-cycle assessment to account for upstream electricity, fuels, chemicals, equipment replacement, emissions, transport, and residue handling.
Credit water, fertilizer, disposal, or energy savings only when displacement is documented. Report impacts separately. Test low, central, and high assumptions for seasonal throughput, electricity sources, hauling distances, and actual use of recovered resources. The U.S. Environmental Protection Agency identifies life-cycle impacts, cost effectiveness, and health risks as relevant to reuse comparisons.
| Metric per functional unit | Compliant baseline | Reuse case | Uncertainty to test |
|---|---|---|---|
| Climate impact, kg CO₂e | Full baseline inventory | Full reuse inventory minus verified credits | Electricity mix; storage and treatment emissions |
| Cumulative energy demand, consistent energy units | Collection through final management | Collection through reuse and residue management | Seasonal operating rate; usable energy recovery |
| Consumptive water use, m³ | Consumptive use across the boundary | Added water and consumption minus verified displacement | Actual reuse demand; distinguish consumption from withdrawal |
| Eutrophication, stated nutrient-equivalent units | Releases from baseline pathways | Releases from effluent and residue pathways | Nutrient loads; actual fertilizer replacement |
| Residues, kg or m³ | Amounts and approved destinations | Amounts and approved destinations | Moisture content; hauling distance |
| Annualized cost, $ | Capital and operating costs | Capital and operating costs minus verified savings | Throughput; maintenance; recovered-product use |
Conclusion: When Reuse Supports Circular Production
Reuse is circular only when recovered resources serve a defined, useful purpose, meet technical and legal requirements for that use, and cause less environmental harm than a compliant baseline. Compare reuse with compliant options for freshwater supply, treatment or disposal, and residue management.
Reduce Waste Before Recovering Resources
Start at the mill. Reduce wash water, keep solids and oil out of drains, and separate clean streams from high-strength wastewater. Keep nutrient loading within crop and soil capacity. Moving wastewater onto land is not resource recovery unless its value and safety are proven.
Set Approval Criteria and Monitoring Rules
Use the results above to decide whether reuse can be approved, needs conditions, or is unsuitable. Apply the matrix below alongside state and local requirements, after reviewing water, soil, and impact data together. Some sites need both added treatment and application limits. Approval also depends on worker safety and enough seasonal storage.
| Classification | Evidence needed | Required action |
|---|---|---|
| Approved with routine monitoring | The intended use is permitted; water quality meets applicable limits; soil drainage and crop tolerance are adequate; pollutant loads and energy use improve on the baseline; residues have documented outlets. | Approve with scheduled monitoring of water, soil, crops, groundwater, energy use, and residues. |
| Approved after additional treatment | Reuse has a clear benefit, but water quality does not meet intended-use targets. | Improve treatment and confirm compliance through repeat sampling before approval. |
| Approved only with restricted application | Loading, seasonal, crop, buffer, or soil restrictions can control risk. | Require a site-specific plan with maximum mass limits, weather restrictions, monitoring, and stop-work triggers. |
| Not suitable under current conditions | Persistent toxicity or salinity, unacceptable groundwater or crop risk, inadequate storage, unreliable treatment, unresolved residues, excessive energy use, or lack of regulatory approval. | Do not reuse under the proposed conditions. Redesign the process or use a compliant alternative. |
Set soil and crop baselines, then monitor during and after the season. Record treatment results, field locations, application volumes, weather, energy use, and residue destinations.
Set written triggers for rising salinity, declining infiltration, crop injury, groundwater detections, or treatment failure. Each trigger requires action: stop application, retest, reduce loading, improve treatment, or use compliant disposal. Require review by a soil specialist and wastewater engineer before expanding reuse.
FAQs
How do I determine a safe wastewater application rate?
Start with a waste audit to check what’s in your wastewater. Next, consult local authorities, confirm application limits, and get the required permits. Regulations vary by location.
Untreated olive mill wastewater contains organic pollutants and phenolic compounds that can make soil more acidic and harm plants. In some cases, smaller, controlled applications have improved soil nutrients without negative effects. Still, local requirements must guide your application rate.
Can repeated reuse cause long-term soil damage?
Yes. Repeatedly reusing untreated or poorly managed olive mill wastewater can make soil more acidic, lead to salt buildup, and inhibit microorganisms that soil needs. Pollutants, including phenolic compounds, can also seep into groundwater.
To protect soil health and productivity for Big Horn Olive Oil production, producers must use treated wastewater and follow strict application limits. Treatment options include anaerobic reactors and filtration systems.
When do reuse benefits outweigh treatment energy costs?
Reuse can deliver returns that outweigh treatment energy costs when recovered byproducts - biogas, biofertilizers, and phenolic antioxidants - help cover operating expenses and bring in revenue.
For mills with steady production volumes, resource recovery can turn waste disposal into a source of profit. Advanced systems cost more upfront, but they can pay off over time by cutting compliance fees and water purchasing costs while improving the quality of premium extra virgin olive oil.