

Techno-Economic Review of Olive Wastewater Reuse
Olive mill wastewater reuse makes financial sense only when usable outputs and avoided disposal costs exceed the full seasonal cost. I would start with actual harvest volumes, local permit requirements, and confirmed outlets - not equipment prices alone.
One reviewed model reported a 12-year payback and 6% internal rate of return, but it relied on other waste feedstocks outside olive harvest season. That is not proof that olive wastewater alone can pay for treatment.
In this review, I compare ponds, solar distillation, pretreatment, digestion, membranes, oxidation, adsorption, land application, composting, and phenolic recovery. My checks are simple:
- Output: Does testing show that the water, energy, or material fits its intended use?
- Cost: Do savings and sales cover equipment, labor, storage, hauling, testing, and residue disposal?
- Season: Can the system handle harvest flows, downtime, and periods with no buyer or reuse demand?
- Responsibility: Who handles permits, testing, and residues under on-site, shared, or contracted treatment?
My bottom line: <u>compare complete systems, not isolated treatment prices</u>. For U.S. projects, confirm state and local rules before assigning any dollar value to recovered water or materials.
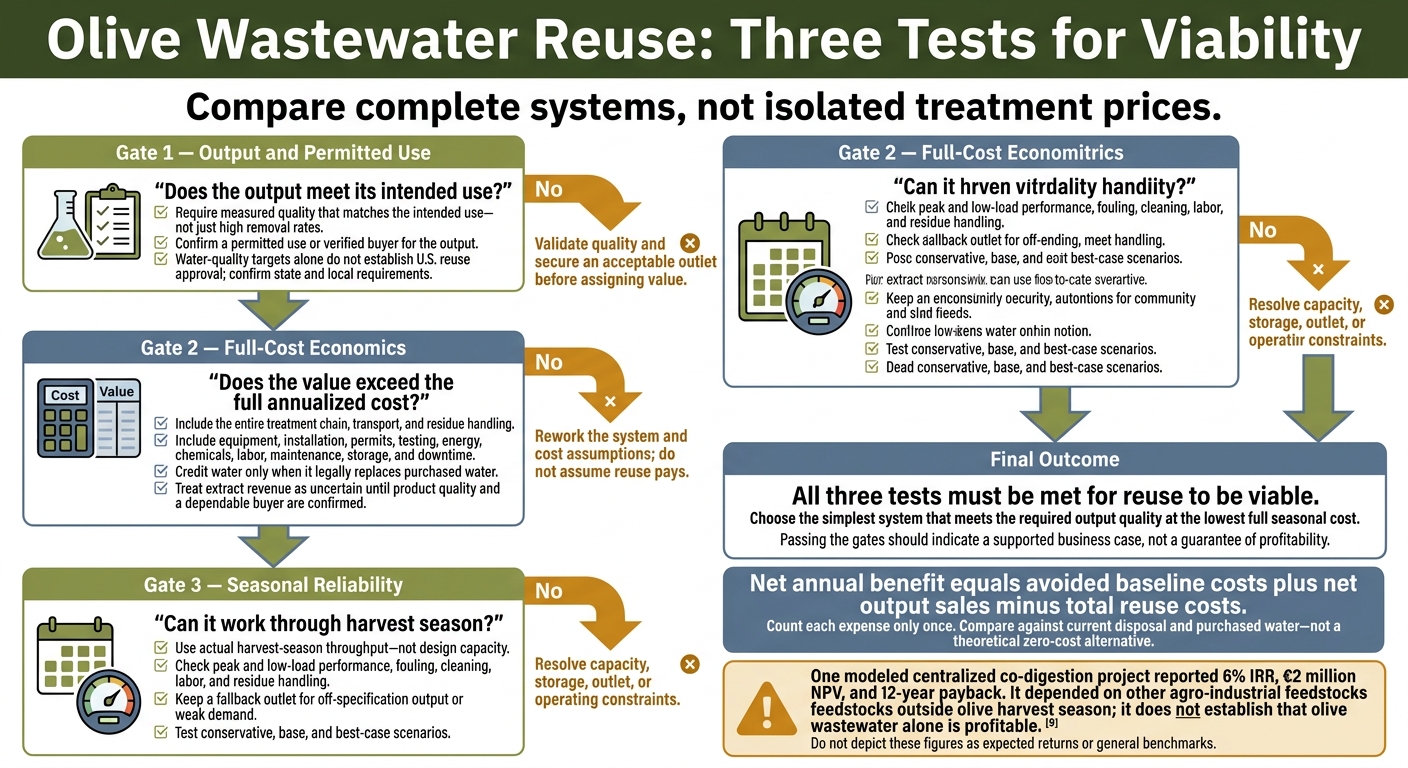
Olive Wastewater Reuse: Three Tests for Viability
P. Kougias | Valorization of olive mill wastewaters in the era of circular bioeconomy
sbb-itb-4066b8e
2. Treatment Options and Cost Drivers
Compare output quality, volume, and permitted use - not removal rates alone. Track each output’s tested quality and confirm that it has a permitted use or a verified buyer. Lab results and projected values do not equal commercial returns.
The table below outlines the main costs for each treatment and which outputs may support reuse. Use it to compare capital costs, operating demands, and likely reuse value.
| Treatment model | Main cost drivers | Reuse quality | Recoverable value | Process complexity | Best fit |
|---|---|---|---|---|---|
| Evaporation ponds or storage ponds | Land, excavation or liners, pumping, fencing, odor control, seepage protection, residue removal, monitoring, and final disposal | Volume-reduced wastewater or evaporated residue; neither is automatically reusable water | Limited; concentrated solids need further testing | Low to moderate, but climate-dependent | Small mills with suitable land or shared regional facilities |
| Solar distillation | Land or collector area, construction, maintenance, weather dependence, condensate collection, residue handling, and water testing | Condensate quality must be validated; evaporation losses do not count as recovered water | Recovered condensate and concentrated solids | Moderate; condensate must remain separate from residue | Regions with strong solar resources and enough land |
| Coagulation-flocculation or lime pretreatment | Chemicals, mixing, sludge handling, labor, and chemical residuals | Clarified or partially treated water; usually an intermediate stream | Lower downstream membrane or biological-treatment load | Low to moderate | Small and mid-size operations needing pretreatment |
| Biological treatment or anaerobic digestion | Reactor and controls, heating or pumping, pH and nutrient adjustment, pretreatment, seasonal loading, and digestate management | Effluent may need polishing before reuse | Biogas, lower disposal costs, and treated water | Moderate to high | Shared, centralized, or consistently fed facilities |
| Ultrafiltration and nanofiltration | Electricity, membrane replacement, fouling, cleaning chemicals, pretreatment, labor, and concentrate disposal | Permeate may support selected reuse after validation; concentrate remains a liability | Recycled process water and separated phenolic fractions | High | Medium to large facilities or contracted treatment |
| Advanced oxidation | Oxidants, electricity, reactors, catalysts, safety controls, and post-treatment testing | Can improve water quality; residual oxidants and by-products need assessment | Mainly water recovery; limited direct product revenue | High | Facilities with technical staff and enough wastewater volume |
| Activated carbon or resin adsorption | Adsorbent purchase, regeneration, replacement, desorption chemicals, and spent-material disposal | Polished water with lower phenolic concentration; final reuse needs independent testing | Recovered phenolic fractions and adsorbent reuse | Moderate to high | Facilities with a reliable extract buyer or shared processing plant |
| Controlled land application | Transport, spreading equipment, soil testing, application-rate control, buffer zones, monitoring, and permits | Agronomic use depends on acceptable soil conditions, salinity, phenols, and loading | Moisture, organic matter, and nutrients; value depends on the site | Moderate regulatory and monitoring complexity | Mills near suitable agricultural land |
| Composting with suitable solids | Bulking material, turning or aeration, space, moisture control, maturity testing, odor control, transport, and outlet development | Mature compost may serve as a soil amendment if it meets applicable quality requirements | Soil amendment and organic-matter recovery | Moderate | Small to mid-size mills with reliable residue and compost markets |
Treat this table as a screening guide, not a break-even estimate.
Ponds, Solar Distillation, and Pretreatment
Pond costs depend on climate, available land, and storage time. Pretreatment pays off only when lower downstream loading or fouling offsets the added expense.
Solar distillation must collect condensate separately from residue. Coagulation-flocculation and lime treatment generally produce intermediate streams, not reuse-ready water. More controlled systems usually require more energy, chemicals, and monitoring.
Biological Treatment and Biogas Recovery
Phenol inhibition, nutrient imbalance, low alkalinity, and seasonal feed can destabilize digestion and increase conditioning and energy costs.
Count only usable captured methane, after conversion losses and internal use. Effluent may still need polishing. Digestate also needs a tested, permitted outlet before it can receive fertilizer credit.
Membranes, Oxidation, and Adsorption
These systems can improve water quality, but concentrate and spent media often dominate total costs.
Membranes separate pollutants rather than eliminate them. Oxidation requires checks for residual oxidants and by-products. Adsorption costs depend on regeneration performance and the quality of the recovered extract.
Land Application, Composting, and Phenolic Recovery
These pathways differ most in outlet requirements, transport costs, and whether the output has a real buyer or a permitted receiving site.
Land application: Transport distance and site-specific loading limits determine costs and usable volumes. Credit nutrient or moisture value only when soil conditions, salinity, phenols, and a permitted receiving site support agronomic use.
Composting: Suitable solids and carbon-rich bulking material affect processing costs and product maturity. Credit soil-amendment value only after testing confirms product suitability and a reliable outlet exists.
Phenolic recovery: Include processing, quality control, and applicable permit and outlet requirements in recovery costs. Keep three things separate: measured phenol capture, a characterized extract, and a documented sale.
3. Study Results: Costs, Savings, and Break-Even Points
The studies below report treatment costs, savings, payback, and break-even results in their original currencies. Missing figures mean “not reported,” not zero.
| Citation and year | Location | Process | Scale/status | Reported treatment cost | Energy or consumables | Value stream | Economic result | Key caveat |
|---|---|---|---|---|---|---|---|---|
| , 2021 | Not specified | MF–UF–NF–RO membrane train; alternative replaces RO with advanced oxidation for pesticide degradation | Modeled | €253/m³ and €292/m³ of wastewater, respectively | Utilities included; labor was the largest annualized-cost component | Polyphenol recovery and water reuse | No break-even price reported | Simulated integrated costs, not commercial operating results; detailed accounting requires review of the original paper |
| , 2014 | Not specified | Fenton-like pretreatment, clarification/filtration, then RO; compared with conductive-diamond electrochemical oxidation and ozonation | Pilot, averaging 2,642 gallons/day (10 m³/day) | RO stage: €0.87/m³; Fenton-like process: €0.70/m³; conductive-diamond electrochemical oxidation: €2.40/m³; ozonation: €8.50/m³ | Approximately 510 sq. ft. (47.4 m²) of membrane area; pretreatment chemicals required | Treated water | No product break-even reported | Stage costs only, not a complete OMWW treatment cost |
| , year unreported | Unreported | Activated-carbon treatment and reuse | Modeled | Initial: 101.25 SAR/m³; lower dosage with five reuse cycles: 10.25 SAR/m³ | Regeneration energy and chemical quantities unreported | Treated water use or avoided disposal | Unreported | Savings depend on retained treatment performance and regeneration costs |
| , 2026 | Not specified | Biogas delivery vs. field application | Modeled haul-distance comparison, 13,209 gallons (50 m³) | Delivery: €10.49/m³; field application: €10.51/m³ | Assumptions cover transport, loading, unloading, and spreading; detailed cost breakdown unreported | Avoided disposal; biogas feedstock or agricultural application | Approximately 12.4 miles (20 km) | Applies within the study’s transport boundary |
| , year unreported | Unreported | Centralized anaerobic co-digestion | Modeled, 780 m³/day during harvest | Unreported; transport included in raw-material costs | Olive effluent during harvest and other agro-industrial materials outside the season | Energy and avoided disposal | 6% IRR; €2 million NPV; 12-year payback | Depends on co-feedstocks; does not show that olive wastewater alone can support the project |
Some options reduce disposal costs, but only a few report well-supported net returns. The main distinction is whole-system cost versus the cost of one treatment stage.
Combined Treatment Costs and Adsorbent Reuse
The modeled membrane-train figures cover integrated treatment, while the pilot figures cover individual stages. Leave out the proposed €1.50–€2.00/kg break-even range until the original paper clarifies what “kg” measures and which expenses the range covers. For activated carbon, request regeneration costs and treatment results after every reuse cycle.
Transport Costs and Disposal Savings
Distance and destination fees often determine whether reuse costs less than disposal. Below the study’s roughly 12.4-mile threshold, field application was cheaper; beyond it, biogas delivery cost less. For U.S. projects, recalculate using local haul distances, road conditions, truck capacity, fuel prices, seasonal volumes, permitting, and destination fees.
Returns from Water, Energy, Fertilizer, and Extracts
A pathway produces net value only after all costs are counted. Net annual benefit equals avoided baseline costs plus net output sales minus total reuse costs.
- Value water only for the volume that can legally be used and actually replaces purchased water.
- Count net output sales and avoided baseline costs after accounting for internal use, testing, finishing, storage, transport, marketing, and residues. Count each expense only once.
- Credit fertilizer and extract sales only when tested quality, accepted quantities, and buyer prices are documented.
The digestion model’s financial results depend on year-round co-processing, not olive wastewater alone.
4. Research Limits and Small-Business Decisions
Evidence Gaps and U.S. Reuse Rules
Pollutant removal, low treatment cost, and profitable reuse are separate findings. OMWW composition varies with olive variety, maturity, processing technology, water use, and storage time. Before citing lab or pilot results, require data on continuous operation, seasonal loading, capacity, fouling, downtime, staffing, residue generation, and verified product quality. Report treatment cost per cubic meter (m³) and cost per verified output, such as 1 m³ of reuse-grade water or 1 kWh of recovered energy.
Meeting water-quality targets does not mean a project has U.S. reuse approval. State and local rules vary by location, crop, and intended use. Contact the state water or environmental agency, local permitting authority, county health department, and extension specialist. Confirm allowable crops, irrigation methods, setbacks, storage, monitoring, worker protections, and reporting requirements.
Check soil infiltration, crop sensitivity, salinity, nutrient loading, phenolics, groundwater vulnerability, and seasonal irrigation demand. Once compliance requirements are clear, compare on-site, shared, and contracted treatment by cost, control, and responsibility for residues.
On-Site, Shared, and Contracted Treatment
Use the following factors to compare ownership models after regulatory screening.
| Decision factor | On-site | Shared facility | Contracted treatment |
|---|---|---|---|
| Annualized cost | Highest capital, permit, land, utility, and maintenance burden; little transport needed. | Shares capital and staffing costs, but collection and return transport can erase savings. | Service fees replace capital costs, but transport, minimum-volume charges, surcharges, and disposal fees remain. |
| Staffing | Requires trained staff or service support. | Shared staffing may improve utilization; uneven deliveries can strain capacity. | Confirm operator support and harvest-season availability. |
| Process control | Most control over timing and quality. | Define sampling, acceptance limits, pretreatment, and liability for noncompliant output. | Assign testing duties and responsibility for verified reuse claims. |
| Seasonal utilization | Idle capacity increases unit costs. | Savings depend on compatible volumes and schedules. | Confirm harvest-season capacity and volume commitments. |
| Residue responsibility | The mill generally manages sludge, concentrates, and spent media. | Assign ownership and disposal costs explicitly. | Specify responsibility for residues, spills, rejected loads, and compliance. |
Build a Full-Cost Seasonal Business Case
Evaluate the chosen model using actual harvest-season throughput - not design capacity. Measure total volume across the campaign and peak flow, then test treatment under both peak and low-load conditions. Track fouling, cleaning, labor, odor, residues, and the quality of the intended output. Shared or contracted treatment isn't automatically cheaper: distance, minimum charges, and harvest congestion can erase savings.
Include equipment, installation, tanks, land, buildings, permits, engineering, sampling, laboratory analysis, energy, chemicals, labor, maintenance, cleaning, replacement media, insurance, downtime, storage, transport, and residue disposal. State the useful life, discount rate, financing terms, residual value, and annualized capital costs. Model at least a conservative case, a base case, and a best-case scenario.
For example, the conservative case could use lower throughput, higher energy and disposal costs, more downtime, and no revenue from uncertain extracts; the best-case scenario could include high utilization and verified coproduct sales only if contracts or test results support them.
Report payback or net present value only after stating the assumptions. Compare the result with the cost of current disposal and purchased water - not a theoretical zero-cost alternative.
Supplier Checks for Olive Oil Brands
For brand owners, the focus shifts from plant design to supplier verification. Request the reporting period and calculation boundary for wastewater volume managed, cubic meters treated, water actually reused, net energy recovered, pollutant loads reduced, residues generated, and final destinations. Ask for measurement methods, sampling frequency, baseline conditions, mass-balance assumptions, permits, and third-party verification where available.
For a brand such as Big Horn Olive Oil, these checks support sourcing and environmental reporting; they do not prove treatment ownership, product quality, authenticity, or health claims.
5. Conclusion: Three Tests for Viable Reuse
Across the studies reviewed, removal performance alone did not determine whether reuse made sense. Reuse also had to pay for itself under seasonal conditions. Choose the simplest system that meets the required output quality at the lowest full seasonal cost.
Test one: Does the output meet its intended use? Require measured quality that matches the intended use - not just high removal rates.
Test two: Does the value exceed the full annualized cost? Account for the entire treatment chain, transport, and residue handling before counting recovered products and avoided disposal or hauling costs. Treat extract revenue as uncertain until both product quality and a dependable buyer are confirmed. Changes in harvest timing, transport, or residue handling can quickly erase the margin.
Test three: Can it work through harvest season? The system must handle harvest-season flows and fit residue-handling needs. Keep a fallback outlet for output that fails to meet specifications or when demand is weak. Check performance using verified seasonal results and conservative assumptions; all three tests must be met for reuse to be viable.
FAQs
How much wastewater makes reuse worth the investment?
Reuse pays off when its net value per cubic meter (264.17 U.S. gallons) is positive compared with compliant discharge or treatment. Treatment costs range from about $0.30 to $11.60 per cubic meter. Annual costs for 1,000 cubic meters (264,170 U.S. gallons) run roughly $10,250 to $101,250.
Returns usually come from recovered resources, such as biogas or phenolic compounds, verified savings on water, fertilizer, or disposal, or a mix of both. Resource recovery can offset energy costs and operating expenses.
How can small mills pilot reuse before investing?
Start by reducing wash water use, keeping stormwater separate, and removing solids and oil. Measure wastewater volume, COD, BOD, and phenols.
Pilot-test treatment during peak season, covering startup, cleaning, process upsets, and seasonal changes in wastewater. Track energy, chemicals, labor, maintenance, and costs per 264.17 gallons. Assess results based on water quality and total economic impact - not removal rates alone. Confirm that reuse is a safe alternative to disposal and meets regulatory requirements.
How can brands verify suppliers’ wastewater reuse claims?
Ask for clear data, not just removal percentages. Review laboratory results for BOD, COD, salts, pH, and toxicity across the milling season to see how wastewater quality changes as mill conditions vary.
Request documentation showing that wastewater quality meets local reuse requirements and soil or crop safety benchmarks. Confirm formal, written state and local approval for the specific reuse application. Discharge permits do not authorize irrigation or cleaning.